
Htop is an interactive process viewer for Ubuntu that helps you identify CPU-heavy applications, watch memory and swap use, and manage stalled processes without leaving your terminal. The classic top command already ships on normal Ubuntu systems through procps; install htop when you want a scrollable, color-coded interface with mouse support, search, filtering, tree view, and easier process actions.
If htop is already installed, you can skip to the usage sections. Otherwise, the APT package is the safest default, the Snap package currently publishes htop 3.5.1 on latest/stable, and the manual GitHub source method in this article gives advanced users a home-directory build with a repeatable update helper.
Install htop on Ubuntu
Check Whether htop Is Already Installed
If you are checking a system that may already include htop, confirm the active command path and version first:
command -v htop && htop --versionIf command -v htop prints no path or your shell reports that htop is not found, continue with one of the installation methods.
Update Ubuntu Packages
Before installing htop, update all existing Ubuntu packages to maintain stability, security, and compatibility with new software:
sudo apt update && sudo apt upgradeThese commands use
sudofor package-management tasks. If your Ubuntu user account does not have sudo privileges, visit our guide on how to add a user to sudoers on Ubuntu before continuing.
Choose an htop Installation Method
Ubuntu offers three practical ways to install htop. Use APT for the distro-managed package, Snap for an automatically refreshed store build, or the manual GitHub source method when you specifically need the current upstream release outside the system package database.
| Method | Source | Channel | Updates | Best Fit |
|---|---|---|---|---|
| APT (recommended) | Ubuntu repository | Distribution default | Through apt upgrade | Most desktops, servers, and scripts |
| Snap | Snap Store | Store stable channel | Automatic snap refreshes | Users who want the current store build |
| Manual source | GitHub Releases | Upstream source release | Manual helper rerun | Advanced users needing a home-directory build |
APT is recommended for most users because it integrates directly with Ubuntu’s package management. Snap and the manual source build both currently provide htop 3.5.1, but Snap is published by the verified Snap Store account maxiberta* rather than the upstream htop project, and the source method is outside APT/Snap update management.
Use one htop method for normal daily use. If more than one method is installed, run
command -v htopto confirm whether your shell is launching the APT binary, Snap wrapper, or home-directory source build.
Install htop with APT
Install htop from the default Ubuntu repository:
sudo apt install htopVerify the installed version:
htop --versionhtop 3.4.1
The output displays your installed htop version. Ubuntu 26.04 ships htop 3.4.1, Ubuntu 24.04 includes 3.3.0, and Ubuntu 22.04 provides 3.0.5. The core monitoring, sorting, filtering, and process-management features in this article work with any 3.x release.
Install htop with Snap
The Snap package is useful when you want the current Snap Store stable build and do not mind Snap confinement. If the snap command is missing on your system, install snapd before using this method.
sudo apt install snapdSkip that prerequisite when snap --version already works.
sudo snap install htopVerify the Snap installation:
snap list htopName Version Rev Tracking Publisher htop 3.5.1 5913 latest/stable maxiberta*
The Snap version runs in a confined environment. Its default connections include observation interfaces such as
system-observe, whilemount-observeandnetwork-controlremain disconnected until you intentionally connect them withsudo snap connect htop:mount-observeorsudo snap connect htop:network-control.
Build htop from GitHub Source
Use this optional manual method when you need the latest upstream htop release from GitHub, want a home-directory install, or cannot change the system package database after build prerequisites are already present. The helper installs htop under ~/.local/opt/htop and exposes ~/.local/bin/htop, so it does not overwrite Ubuntu’s /usr/bin/htop.
Install Source Build Dependencies
Install the compiler, autotools, JSON parser, download tool, and common htop feature libraries:
sudo apt install curl jq build-essential autoconf automake autotools-dev pkg-config libncurses-dev libcap-dev libsensors-dev libnl-3-dev libnl-genl-3-dev ca-certificatesThe libncurses-dev package supplies the ncurses headers used by current Ubuntu releases. Some older upstream examples mention libncursesw5-dev, but that package name is not available on Ubuntu 24.04 or 26.04.
Create the htop Source Update Helper
Create a reusable update-htop-source helper. With no argument, it resolves the latest stable GitHub release through the GitHub API. With a version argument, it builds that exact release tag, which is useful when you want to repeat a tested version.
mkdir -p "$HOME/.local/bin"
export PATH="$HOME/.local/bin:$PATH"

cat > "$HOME/.local/bin/update-htop-source" <<'EOF'
#!/usr/bin/env bash
set -euo pipefail

REPO_API="https://api.github.com/repos/htop-dev/htop/releases/latest"
WORKDIR="${HTOP_SOURCE_WORKDIR:-$HOME/htop-source-build}"
PREFIX_BASE="${HTOP_PREFIX_BASE:-$HOME/.local/opt/htop}"
BIN_DIR="${HTOP_BIN_DIR:-$HOME/.local/bin}"
TAG="${1:-}"

if [ -z "$TAG" ]; then
  TAG=$(curl -fsSL "$REPO_API" | jq -r 'select(.draft == false and .prerelease == false) | .tag_name')
fi

if ! [[ "$TAG" =~ ^[0-9]+[.][0-9]+[.][0-9]+$ ]]; then
  echo "Could not resolve a stable htop release tag."
  exit 1
fi

ARCHIVE="htop-${TAG}.tar.xz"
SHA_FILE="${ARCHIVE}.sha256"
BASE_URL="https://github.com/htop-dev/htop/releases/download/${TAG}"

mkdir -p "$WORKDIR" "$PREFIX_BASE" "$BIN_DIR"

if [ -x "$PREFIX_BASE/current/bin/htop" ]; then
  VERSION_LINE=$("$PREFIX_BASE/current/bin/htop" --version | head -n 1 || true)
  INSTALLED_VERSION=${VERSION_LINE#htop }
  INSTALLED_TAG=${INSTALLED_VERSION%%-*}
  if [ "$INSTALLED_TAG" = "$TAG" ]; then
    echo "htop ${TAG} is already installed at ${PREFIX_BASE}/current."
    exit 0
  fi
fi

cd "$WORKDIR"
rm -rf "htop-${TAG}" "$ARCHIVE" "$SHA_FILE"
curl -fLO --progress-bar "$BASE_URL/$ARCHIVE"
curl -fLO --progress-bar "$BASE_URL/$SHA_FILE"
sha256sum -c "$SHA_FILE"
tar -xf "$ARCHIVE"

cd "htop-${TAG}"
./configure --prefix="${PREFIX_BASE}/${TAG}"
make -j"$(nproc)"
make install

ln -sfnT "${PREFIX_BASE}/${TAG}" "${PREFIX_BASE}/current"
ln -sfnT "${PREFIX_BASE}/current/bin/htop" "${BIN_DIR}/htop"
"${BIN_DIR}/htop" --version | head -n 1
EOF

chmod +x "$HOME/.local/bin/update-htop-source"
bash -n "$HOME/.local/bin/update-htop-source"
The helper downloads both the release tarball and its .sha256 sidecar, verifies the checksum with sha256sum -c, compiles htop, installs the result into a versioned directory, and then updates the current and htop symlinks.
Build the Tested GitHub Release
Run the helper with the currently tested release tag:
update-htop-source 3.5.1Relevant success lines include the checksum result and the compiled htop version:
htop-3.5.1.tar.xz: OK
htop 3.5.1-3.5.1
For future updates after dependencies are installed, run the helper without a version argument to build the latest stable GitHub release:
update-htop-sourceUse htop to Monitor and Control Processes
Htop uses function keys and arrow keys to navigate, sort, and control processes. The interface also responds to mouse clicks for column sorting and process selection. Press F1 inside htop at any time to open the built-in help screen.
Launch htop
Start htop from any terminal:
htopTo monitor only your own processes, launch htop with a user filter:
htop -u $USERInteractive htop interface displaying system metrics:

The top section displays CPU cores, memory usage, swap usage, and system load averages. Below that, the process list shows PIDs, users, CPU/memory consumption, and command details. You can navigate with arrow keys or click processes with your mouse.
Navigate and Sort Processes
Use arrow keys and function keys to navigate the process list and change sort order:
| Key | Action |
|---|---|
| Up/Down | Move through the process list |
| Left/Right | Scroll columns to view additional metrics |
| F6 | Open sort menu to choose CPU, memory, PID, or other columns |
| F5 | Toggle tree view to show parent-child process relationships |
Click any column header with your mouse to sort by that metric, or use F6 for keyboard-only navigation.
Kill and Reprioritize Processes
Control misbehaving or resource-intensive applications directly from htop:
| Key | Action | When to Use |
|---|---|---|
| F9 → SIGTERM (15) | Gracefully terminate a process | First choice for frozen applications that stop responding |
| F9 → SIGKILL (9) | Force immediate termination | Process ignores SIGTERM and refuses to close |
| F9 → SIGHUP (1) | Reload configuration without restarting | Apply config changes to daemons like Nginx or Apache |
| F7 | Increase priority (lower nice value) | Give a critical task more CPU time |
| F8 | Decrease priority (higher nice value) | Throttle background tasks competing for resources |
Search and Filter Processes
Quickly locate specific processes with search and filter functions:
| Key | Action | Example |
|---|---|---|
| F3 | Search by name; highlights the first matching process | Type nginx to jump to the Nginx worker process |
| F4 | Filter the list to show only matching processes | Type your username to isolate your own processes |
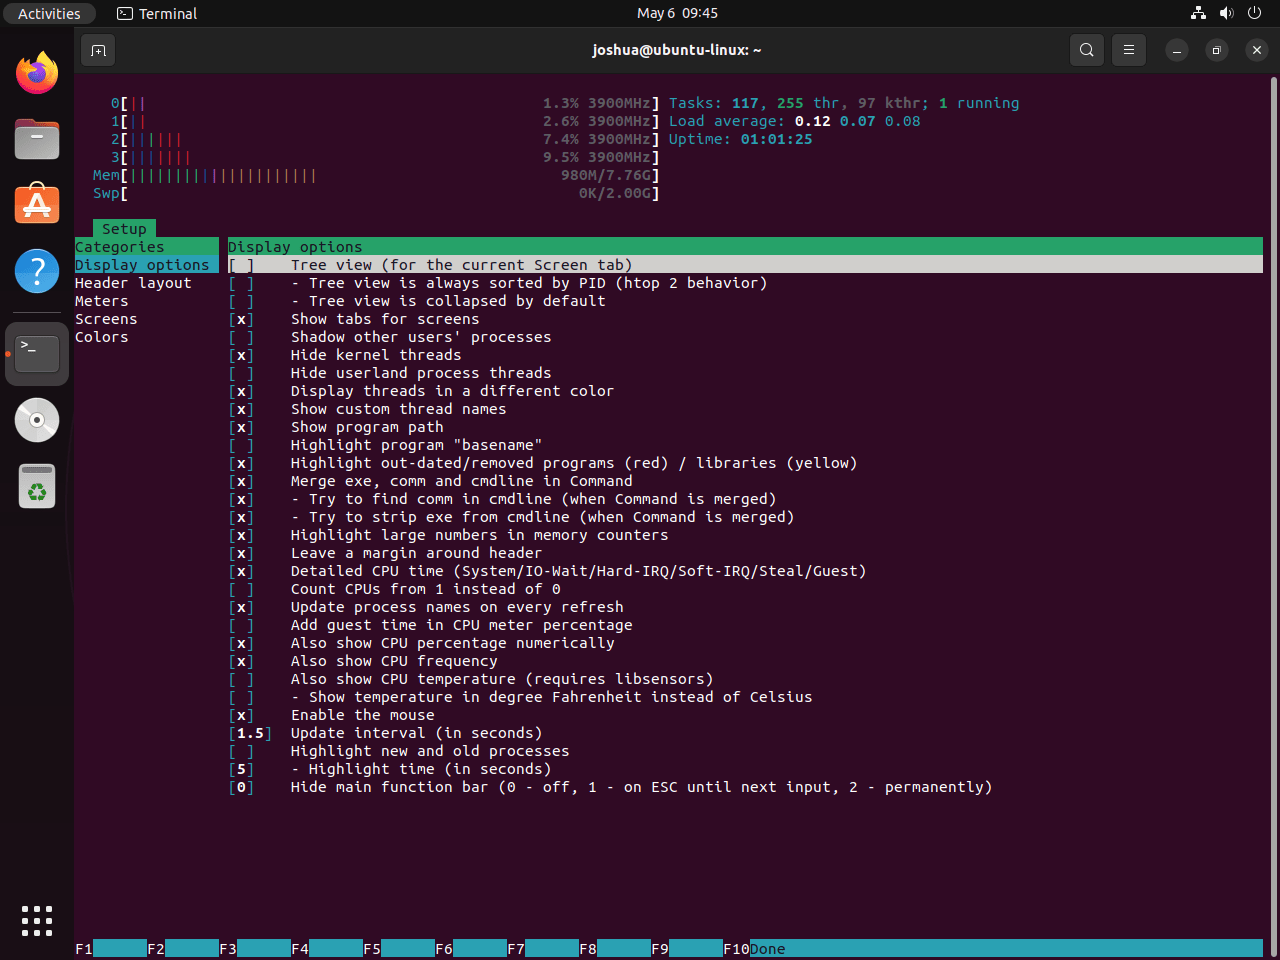
Customize htop Display
Press F2 to open the setup menu where you can customize meters, color schemes, and column layouts. All changes save automatically to ~/.config/htop/htoprc and persist across sessions. Common customizations include:
- Adding or rearranging built-in meters such as CPU, memory, swap, load average, uptime, or battery status where available
- Rearranging columns to prioritize CPU, memory, or I/O metrics
- Switching color schemes for better visibility on light or dark terminals
Htop can show basic I/O-related columns, but it is not a full network monitor. For a broader terminal dashboard that combines CPU, memory, disk, and network panels, use nmon on Ubuntu alongside htop.
The htop setup menu for customizing display options:
Exit htop
Press F10 or Q to exit htop.
htop Command-Line Options
Htop accepts command-line flags that narrow the display to specific processes, adjust refresh rates, or run non-interactively for scripted workflows.
Monitor Specific Processes
Track specific process IDs without distraction from other system activity:
htop -p 1234,5678,91011Replace the numbers with actual PIDs you want to monitor. This narrows the display to only those processes, which is useful when debugging specific applications.
Adjust Update Frequency
By default, htop refreshes every second. Reduce CPU overhead on resource-constrained systems by slowing the update rate:
htop -d 30The -d flag sets the delay in tenths of seconds. In this case, the example updates every 3 seconds instead of every second.
Disable Mouse Control or Use Read-Only Mode
Htop is an interactive monitor rather than a batch reporting tool. Disable mouse input when you want keyboard-only navigation:
htop --no-mouseOn Ubuntu 26.04, Ubuntu 24.04, and current Snap or source builds, add --readonly to disable process-changing actions such as kill and renice:
htop --no-mouse --readonlyUbuntu 22.04’s APT package provides htop 3.0.5, which does not support --readonly. Use the Snap or source method if you need that flag on 22.04. For script-friendly process output, use tools such as ps, top -b, or system-specific exporters instead of htop.
Update htop on Ubuntu
Update htop with the same method you used to install it. Mixing update paths can leave several htop binaries on the same account, so verify the active command path if you switch methods later.
Update APT htop
APT updates htop with the rest of your Ubuntu packages:
sudo apt update
sudo apt upgrade
Update Snap htop
Snap refreshes installed snaps automatically. To request an immediate refresh for htop, run:
sudo snap refresh htopUpdate Source-Built htop
The source helper checks the latest stable GitHub release, downloads the matching tarball and checksum file, rebuilds htop, and updates your home-directory symlinks:
update-htop-sourceIf the selected release is already installed, the helper prints an already installed message with your home-directory install path and exits without rebuilding.
Uninstall htop from Ubuntu
Uninstall htop using the same method you used for installation.
Uninstall htop (APT)
If you installed htop via APT, remove the package first:
sudo apt remove htopPreview unused dependency cleanup separately before removing anything else:
sudo apt autoremove --dry-runIf the preview only lists packages you no longer need, run sudo apt autoremove interactively and review the final prompt.
Uninstall htop (Snap)
If you installed htop via Snap and want a clean app removal without snapd’s saved snapshot, use:
sudo snap remove --purge htopVerify that the snap is gone:
snap list htoperror: no matching snaps installed
Uninstall Source-Built htop
The manual method only creates files in your home directory. Remove the source workspace, versioned install tree, helper, and command symlink:
if [ -L "$HOME/.local/bin/htop" ] && [ "$(readlink "$HOME/.local/bin/htop")" = "$HOME/.local/opt/htop/current/bin/htop" ]; then
  rm -f "$HOME/.local/bin/htop"
fi
rm -rf "$HOME/htop-source-build" "$HOME/.local/opt/htop"
rm -f "$HOME/.local/bin/update-htop-source"
hash -r
Confirm your shell no longer resolves the source-built htop command:
command -v htopIf this still prints a path, another htop method remains installed or your shell has a different custom binary earlier in PATH.
User-specific htop settings can persist after package removal. Remove
~/.config/htoponly if you want to delete customized color schemes, column layouts, and meter configuration.
Troubleshoot Common htop Issues
Most htop installations complete without issues, but the following solutions address common problems.
Package Not Found Error
If APT reports that htop is unavailable, your package cache may be outdated:
E: Unable to locate package htop
To resolve this, update the package cache and retry:
sudo apt update
sudo apt install htop
Then verify the installation succeeded:
htop --versionhtop 3.4.1
If you see Error: Unable to find a match: htop, you are likely using DNF/YUM-family instructions rather than Ubuntu APT commands. Use the APT command in this section on Ubuntu, or follow the Fedora htop guide when Fedora is your actual distribution.
Source Build Helper Cannot Detect or Build htop
If the manual helper cannot detect the latest release, first confirm that GitHub’s API is reachable and jq can parse the response:
curl -fsSL https://api.github.com/repos/htop-dev/htop/releases/latest | jq -r '.tag_name'If that command fails because of a proxy, firewall, or temporary API issue, rerun the helper with a known release tag:
update-htop-source 3.5.1If the configure step reports missing ncurses, capability, sensor, or netlink headers, reinstall the source-build dependencies from the manual method and retry the helper. The dependency package names are release-safe across Ubuntu 26.04, 24.04, and 22.04.
Source-Built htop Is Not Found
If the source build succeeds but htop is still not found, your current shell may not have ~/.local/bin in PATH yet. Add it for the current terminal and clear Bash’s command cache:
export PATH="$HOME/.local/bin:$PATH"
hash -r
command -v htop
Open a new login session later so Ubuntu’s normal ~/.profile PATH handling can pick up ~/.local/bin automatically.
Terminal Display Issues
If htop displays garbled characters or incorrect colors, your terminal may lack proper Unicode or 256-color support. Test with the no-color mode:
htop --no-colorIf monochrome mode works correctly, consider switching to a modern terminal emulator that supports full UTF-8 and color rendering. Meanwhile, check your current terminal capabilities:
echo $TERMxterm-256color
Modern terminals report xterm-256color or similar. If your terminal reports xterm or linux, consider upgrading to a terminal like GNOME Terminal, Konsole, or Terminator.
Permission Denied When Changing Process Priority
Regular users can only adjust nice values for their own processes within restricted ranges. To modify system processes or increase priority (lower nice values), run htop with elevated privileges:
sudo htopVerify you can adjust priority by selecting a process and pressing F7 or F8. The nice value should now change without permission errors.
Incorrect CPU Count on Virtual Machines
Virtual machines sometimes report incorrect CPU topology in htop. If you see more cores than your VM actually has, this reflects the host’s physical CPU configuration rather than your VM’s allocation. The CPU usage percentages remain accurate even if the core count appears wrong.
Slow Process List Updates
If htop feels sluggish or lags behind actual system activity, increase the update frequency:
htop -d 5This updates every 0.5 seconds instead of the default 1 second. Watch the CPU meter in htop itself. If the update frequency causes noticeable CPU spikes, increase the delay value. Faster updates consume more resources, so only use shorter intervals when you need real-time precision for active troubleshooting.
Next Steps with htop
Use APT for the lowest-maintenance Ubuntu setup, Snap when the store package is the better fit, or the GitHub source helper when you intentionally want a manually managed upstream build. After installation, press F2 to tune meters and columns, use F4 to filter busy process lists, and press F9 when you need to terminate a process. For remote server monitoring, install SSH on Ubuntu and run htop over a secure shell session.

Formatting tips for your comment
You can use basic HTML to format your comment. Useful tags currently allowed in published comments:
<code>command</code>command<strong>bold</strong><em>italic</em><blockquote>quote</blockquote>