
When you need live RX and TX numbers from a terminal window, install Bmon on Ubuntu and watch every network interface without leaving the shell. Bmon, short for Bandwidth Monitor, is handy over SSH, during file transfers, or while tracking unexpected traffic spikes.
Ubuntu 26.04, 24.04, and 22.04 package Bmon through the Universe repository, so the same APT workflow handles installation, updates, removal, and a few practical monitoring examples.
Update Ubuntu Before Installing Bmon
Refresh your package lists first so APT pulls the current package set from your configured Ubuntu repositories.
sudo apt update && sudo apt upgradeThese commands use
sudofor package management tasks. If your account does not have sudo access yet, follow the guide on add a new user to sudoers on Ubuntu first.
Install Bmon on Ubuntu Using APT
Bmon lives in Ubuntu’s Universe repository. Standard desktop installs usually have Universe enabled already, but some server or minimal images may need it turned on before the package appears.
If APT returns
Unable to locate package bmon, enable Universe first with the guide on enable Universe and Multiverse in Ubuntu, then rerun the install command.
sudo apt install -y bmonVerify the package state with apt-cache policy so you can confirm both the installed version and the Ubuntu repository that provided it.
apt-cache policy bmonbmon:
Installed: 1:4.0-10build1
Candidate: 1:4.0-10build1
Version table:
*** 1:4.0-10build1 500
500 http://au.archive.ubuntu.com/ubuntu resolute/universe amd64 Packages
100 /var/lib/dpkg/status
Ubuntu 24.04 reports 1:4.0-10, and Ubuntu 22.04 reports 1:4.0-8, but all three supported Ubuntu LTS releases ship the same upstream Bmon 4.0 release.
Use Bmon on Ubuntu
These examples cover the most useful Bmon workflows on Ubuntu, from full-screen traffic monitoring to one-shot output you can drop into scripts. Bmon shows traffic on the Ubuntu system where the command runs, which makes it useful over SSH when you need to check the remote machine rather than your local workstation.
Run Bmon to Monitor Network Traffic on Ubuntu
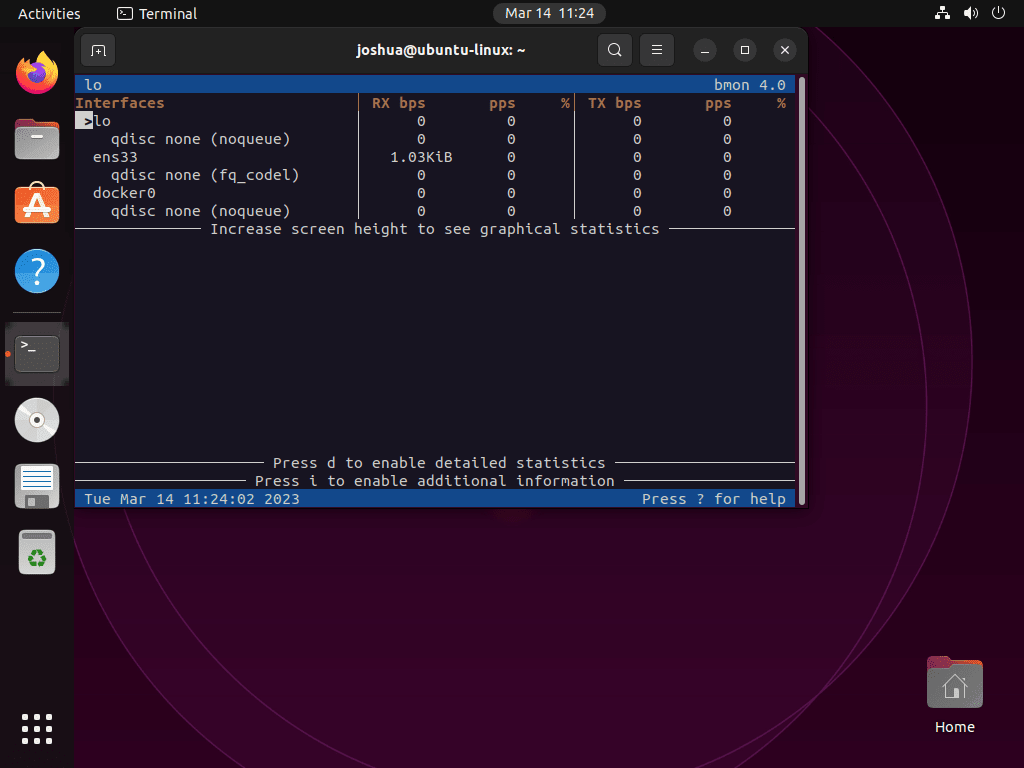
Start with the default interactive view when you want to watch all active interfaces in one screen.
bmonBmon opens a curses-style interface with live throughput, packet counters, and traffic graphs. Use the arrow keys to switch interfaces, press d for more detail, and press q when you want to leave the display.
Filter Bmon Output by Interface on Ubuntu
Check the interface names first so the -p filter matches the device Ubuntu actually uses.
ip -brief linklo UNKNOWN 00:00:00:00:00:00 <LOOPBACK,UP,LOWER_UP> enp0s3 UP 08:00:27:52:d9:70 <BROADCAST,MULTICAST,UP,LOWER_UP>
Use the name from the first column with -p. On many Ubuntu systems that will be something like enp0s3, ens33, or wlp2s0 instead of the older eth0 naming pattern.
bmon -p enp0s3You can also match more than one interface, for example bmon -p 'enp*,lo', when you want Ethernet and loopback traffic on the same screen.
Show Bmon Traffic in Bits Instead of Bytes
Use the bits display when you want the numbers to line up with link speeds quoted by your ISP or switch ports.
bmon -bAdd -U if you want SI units based on powers of 1000 instead of powers of 1024.
bmon -b -UAdjust Bmon Read and Rate Intervals on Ubuntu
Tune the sampling cadence when you want a faster readout or smoother averages during short traffic bursts.
bmon -r 0.5 -R 2.0This example collects new data every half second and calculates rates over a two-second window, which usually gives steadier graphs with less jitter.
Export Bmon Output for Scripts on Ubuntu
Use the ASCII exporter when you need one snapshot for a script, a cron job, or a quick terminal log.
bmon -p lo -o ascii:quitafter=1Interfaces RX bps pps % TX bps pps % lo 0 0 0 0
The loopback interface makes a safe example because every Ubuntu system has lo. Replace it with a live interface such as enp0s3 or wlp2s0 when you want real traffic numbers in the exported output.
Bmon is a live network monitor, not a historical bandwidth database. If you need a small web dashboard for longer-running traffic summaries, install Darkstat on Ubuntu instead.
Exit Bmon Cleanly on Ubuntu
Press q in the interactive interface, or use Ctrl+C if you are done with a live session and want to return to the shell prompt immediately.
Troubleshoot Bmon on Ubuntu
Most Bmon problems on Ubuntu come down to missing repository components, interface naming differences, or monitoring the wrong device.
Show Network Interfaces for Bmon on Ubuntu
If Bmon opens without the interface you expect, confirm that Ubuntu can see the adapter before you troubleshoot Bmon itself.
ip -brief linklo UNKNOWN 00:00:00:00:00:00 <LOOPBACK,UP,LOWER_UP> enp0s3 UP 08:00:27:52:d9:70 <BROADCAST,MULTICAST,UP,LOWER_UP>
If the interface appears here but not in Bmon, rerun Bmon with -a so it includes interfaces that are currently down or otherwise inactive.
bmon -aUse Predictable Interface Names with Bmon on Ubuntu
Ubuntu normally uses predictable names such as enp0s3, ens33, and wlp2s0 instead of the old eth0 pattern. If you copied an older Bmon example that filters eth0, swap in the real interface name from ip -brief link.
Update or Remove Bmon on Ubuntu
Bmon comes from Ubuntu’s Universe repository, so its maintenance workflow stays simple.
Update Bmon on Ubuntu
Use APT’s single-package upgrade path when you want the newest Bmon package available for your Ubuntu release without upgrading unrelated software at the same time.
sudo apt update && sudo apt install --only-upgrade -y bmonRemove Bmon on Ubuntu
Remove the package first if you no longer want Bmon on the system.
sudo apt remove -y bmonIf APT reports that dependencies are no longer required, preview the cleanup before removing anything else. Reused systems can have unrelated autoremovable packages, so continue only when the preview contains packages you actually intend to remove, such as libconfuse-common and libconfuse2 from a fresh Bmon install.
sudo apt autoremove --dry-runStart dependency cleanup only after the dry run looks safe.
sudo apt autoremoveBmon does not create a standard per-user config or cache directory in a basic Ubuntu install, so package removal is usually the only cleanup you need.
dpkg-query -W -f='${db:Status-Abbrev} ${binary:Package}\n' bmon 2>/dev/null | grep '^ii' || echo "bmon is not installed"bmon is not installed
Use apt-cache policy bmon again if you also want to confirm the repository candidate is still available for a future reinstall. On Ubuntu 24.04 and 22.04, the candidate revision changes, but the installed-state check above should still return bmon is not installed after removal.
Conclusion
Bmon is installed on Ubuntu and ready to watch live bandwidth from a terminal session, whether you are troubleshooting a busy server over SSH or checking traffic on a desktop link. Install htop on Ubuntu if you also want process and memory analysis. Install nmon on Ubuntu when you want CPU, disk, and network data in one console view.

Formatting tips for your comment
You can use basic HTML to format your comment. Useful tags currently allowed in published comments:
<code>command</code>command<strong>bold</strong><em>italic</em><a href="https://example.com">link</a><blockquote>quote</blockquote>