

Htop is an interactive process viewer that provides real-time monitoring of CPU usage, memory consumption, and running processes. Unlike top, htop offers color-coded metrics, mouse support, and scrollable process lists, making it easier to identify resource-heavy applications, kill unresponsive processes, or diagnose system slowdowns.
This guide covers installing htop on Fedora using DNF, verifying the installation, and using htop’s keyboard shortcuts and command-line options for process monitoring.
Update Fedora Linux Packages Before Htop Installation
First, ensure your Fedora system is up-to-date to prevent package conflicts during installation:
sudo dnf upgrade --refreshThe --refresh flag forces DNF to refresh the repository metadata before checking for updates, ensuring you receive the latest package versions. If DNF downloads feel slow, consider increasing DNF download speeds by configuring parallel downloads.
Install Htop via DNF Command
Now that your system is updated, install htop from Fedora’s default repositories:
sudo dnf install htopVerify Htop Installation
After the installation completes, verify that htop is accessible by checking the installed version:
htop --versionYou should see output similar to the following:
htop 3.4.1
This output confirms htop is installed and ready to use.
Htop Keyboard Shortcuts
Once htop is running, you can navigate and control it using keyboard shortcuts. Learning these shortcuts speeds up system troubleshooting compared to hunting through menus.
Navigation and Process Management
Use these shortcuts when you need to find specific processes, filter by user, or quickly locate a service by name:
- Arrow Keys (←, ↑, →, ↓): Scroll through the process list to view different processes.
- Shift + U: Clears all process selections (removes all tags).
- Period (.) or Comma (,): Start an incremental search to find a process by its PID (Process ID).
- F1, ?, H: Access the help screen for more information about htop’s features.
- U: Display processes belonging to a specific user.
- F2, Shift + S: Open the settings menu to customize htop’s appearance and behavior.
- Shift + H: Toggle the display of user threads on or off.
- F3, Shift + /: Initiate an incremental search by process name.
- Shift + K: Toggle the display of kernel threads on or off.
- F4, \: Apply a filter to list processes by name.
- Shift + F: Pin the cursor to a specific process for tracking.
Viewing and Sorting Options
When diagnosing performance issues, sorting and view options help you quickly identify resource hogs. Tree view reveals parent-child relationships that explain why certain processes exist:
- F5, T: Switch between the default list view and a tree view of processes.
- Plus (+), Minus (-): Expand or collapse branches in the tree view.
- F6, >: Choose a column to sort the process list.
- Shift + P: Sort processes based on their CPU usage.
- F7: Decrease the Nice value of a process, affecting its priority.
- Shift + M: Sort processes by memory usage.
- F8: Increase the Nice value of a process to lower its scheduling priority.
- Shift + T: Sort processes based on time.
Process Control and System Insights
These shortcuts control processes directly from htop. Use them to terminate frozen applications, trace system calls for debugging, or monitor I/O activity:
- F9, K: Terminate the selected process or processes.
- L: Use the lsof command to list open files for a process.
- F10, Q, Ctrl + C: Exit htop.
- S: Trace system calls using strace for selected processes.
- Space Bar: Tag or select a process.
- Shift + L: Use ltrace to track library calls of a process.
- I: Monitor input/output statistics for processes.
Htop Command-Line Options
Htop also accepts command-line options that configure its behavior at startup. These options are useful when launching htop with a specific view, integrating it into shell scripts, or creating terminal aliases for common monitoring tasks.
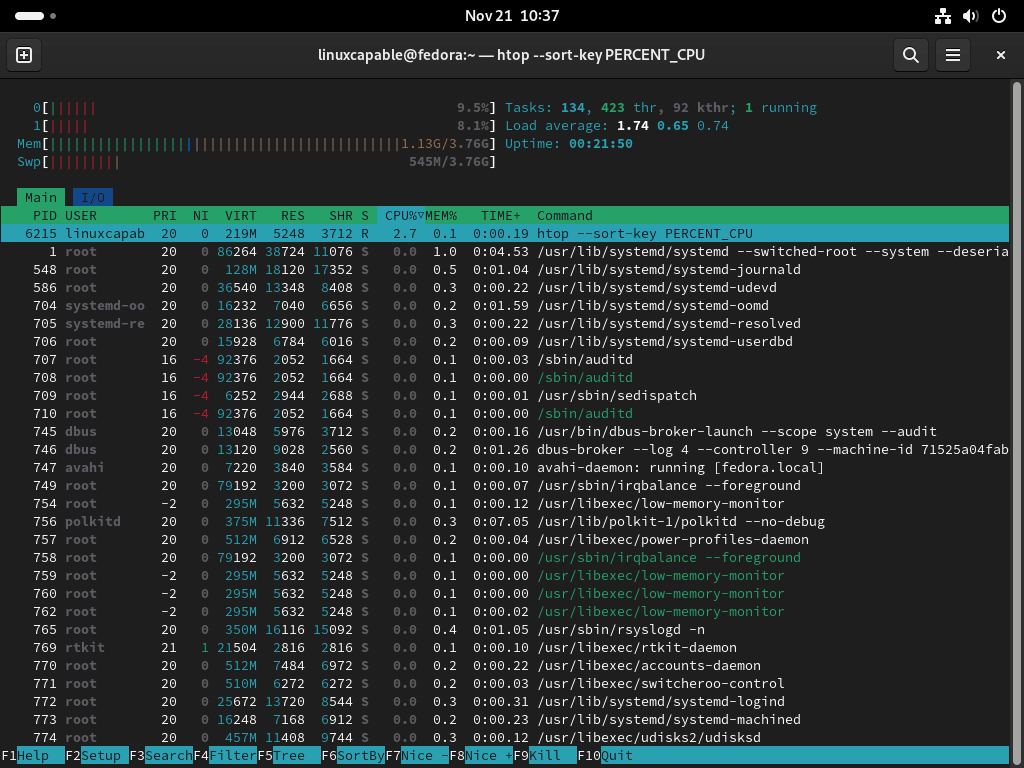
Sorting Processes by CPU Usage
htop --sort-key PERCENT_CPUThis command launches htop and sorts processes by CPU usage, making it easy to identify processes that are consuming significant CPU resources.
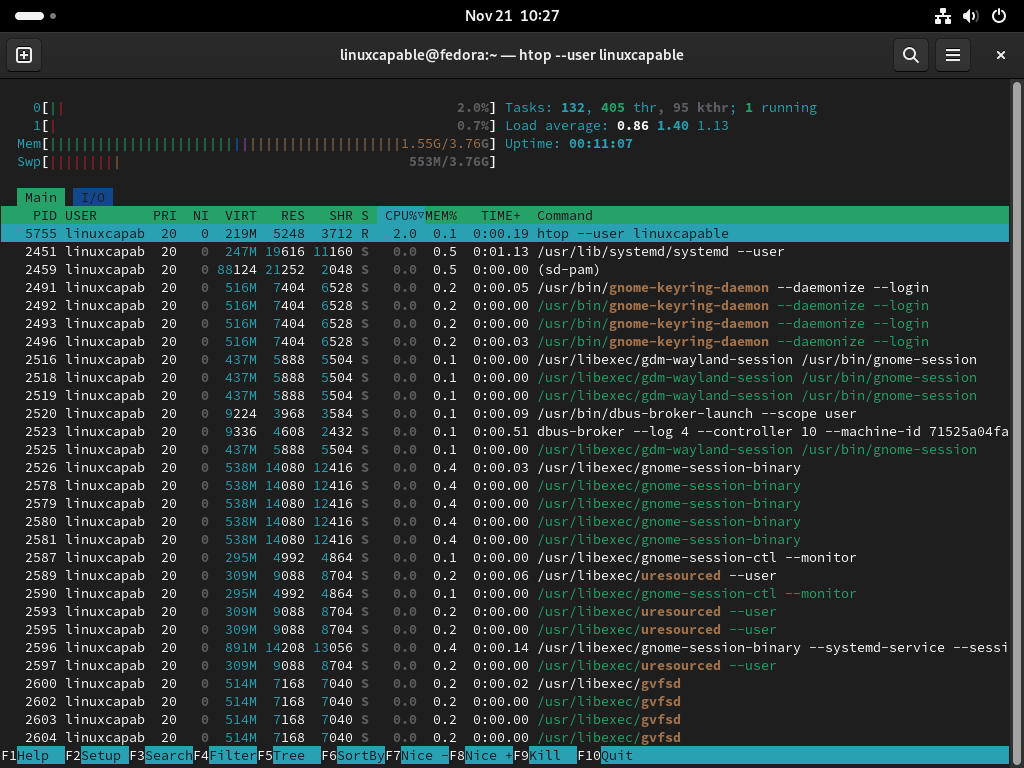
Displaying Processes of a Specific User
htop --user rootReplace root with the target username to filter and display processes under that user. This command helps monitor a specific user’s activities on multi-user systems.
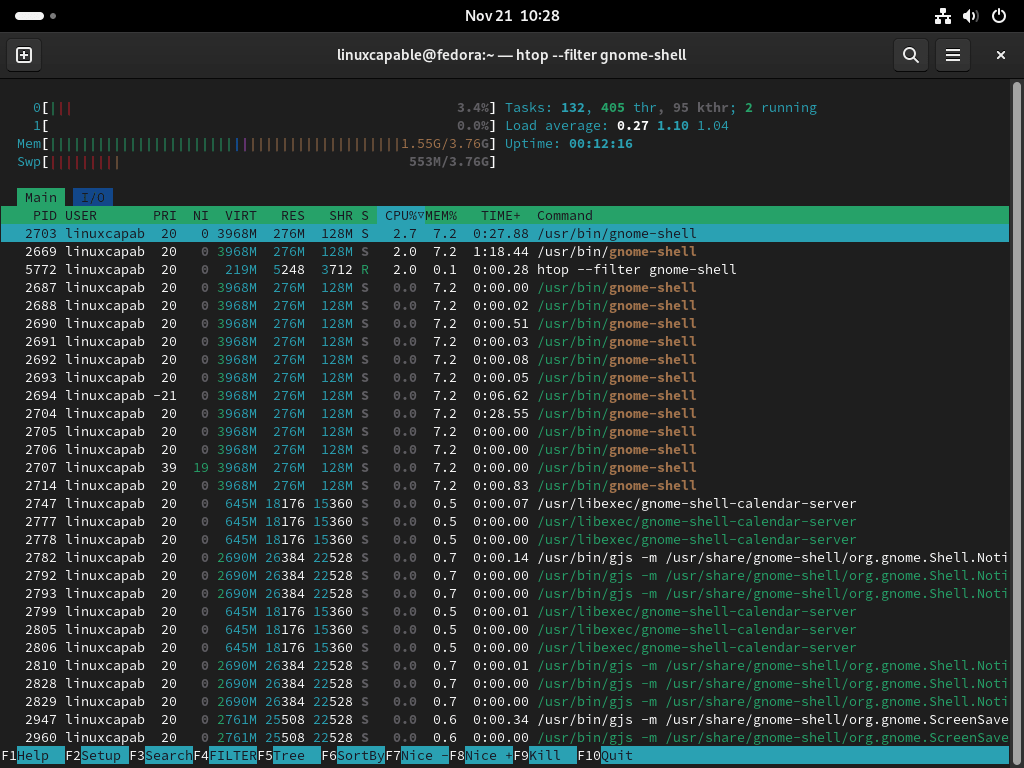
Filtering Processes by Name
htop --filter firefoxReplace firefox with the target process name. This filter displays only processes matching the specified name, which helps focus on specific applications or services.
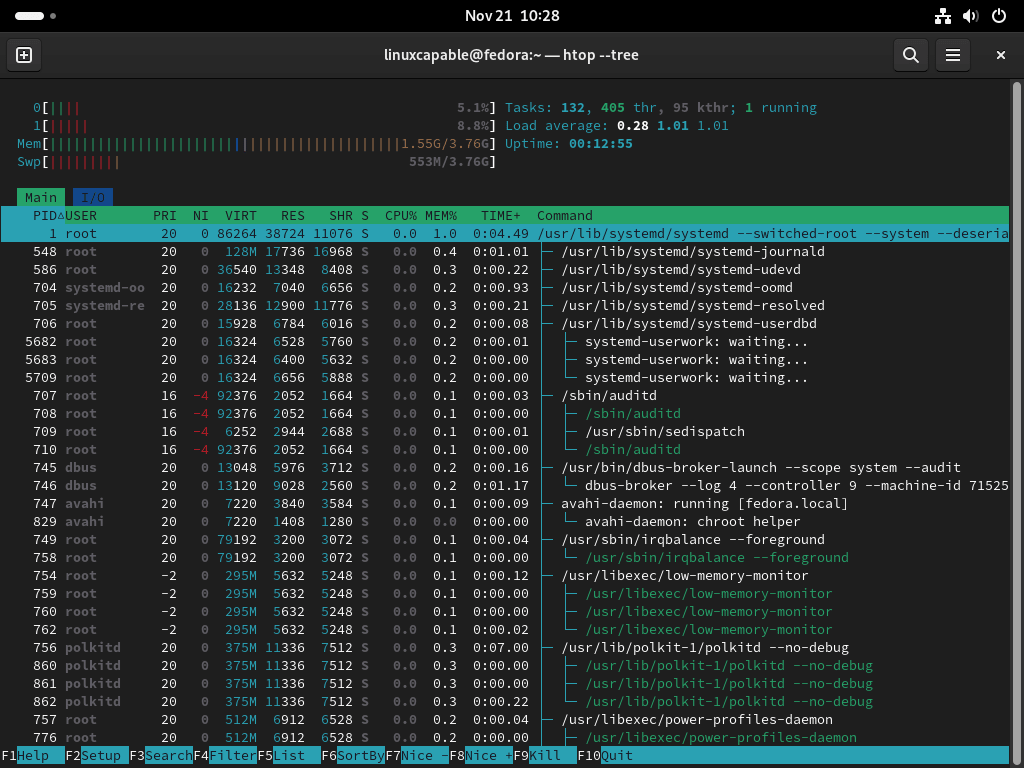
Running Htop in Tree View
htop --treeThis command starts htop in tree view, showing the hierarchy of processes. Tree view helps you understand parent-child relationships between processes.
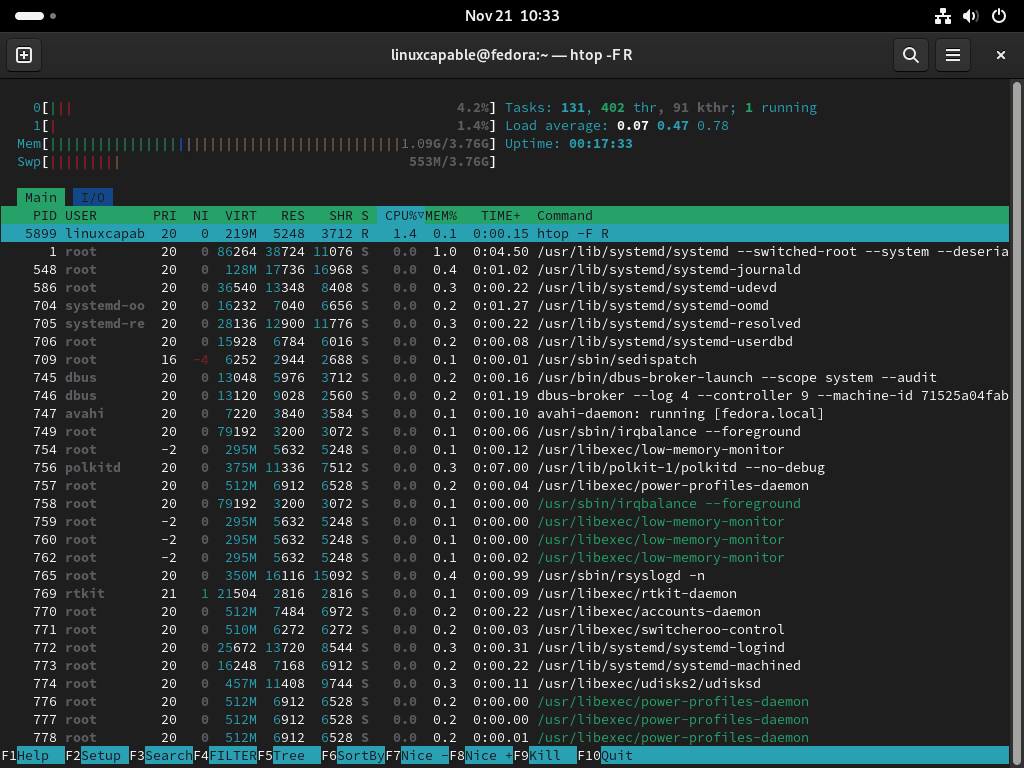
Showing Only Active Running Processes
htop -F RThis filter shows only processes with the “R” state, which indicates actively running processes. You can substitute other process state codes to filter by different states:
R: RunningS: SleepingT: StoppedZ: Zombie
Troubleshooting Htop Issues
Most htop issues stem from permission problems or misunderstanding what htop displays. Below are solutions to common problems.
Cannot Kill or Renice Processes
If pressing F9 (kill) or F7/F8 (renice) has no effect, htop lacks permission to control that process. Run htop with elevated privileges to manage all processes:
sudo htopWithout sudo, htop can only control processes owned by your user account.
High CPU Usage Displayed Incorrectly
By default, htop shows CPU usage per thread, not per core. On a system with 8 cores, total CPU usage can exceed 100% (up to 800% across all cores). To fix this, press F2 (Setup), navigate to Display Options, and enable “Detailed CPU time.”
Process List Empty or Missing Processes
If htop shows fewer processes than expected, kernel threads may be hidden. Press Shift+K to toggle kernel thread visibility, or press Shift+H to show user threads. You can also check if an active filter is applied by pressing F4 and clearing the filter field.
Remove Htop
If you no longer need htop or want to switch to a different monitoring tool, remove it with the following command:
sudo dnf remove htopDNF automatically removes htop along with any unused dependencies (such as hwloc-libs) that were installed alongside it.
Conclusion
You now have htop installed on Fedora for real-time process monitoring. Use the keyboard shortcuts to navigate processes, sort by CPU or memory usage, and terminate unresponsive applications. For automated system maintenance, consider setting up dnf-automatic to keep htop and your other packages updated automatically.

Formatting tips for your comment
You can use basic HTML to format your comment. Useful tags currently allowed in published comments:
<code>command</code>command<strong>bold</strong><em>italic</em><blockquote>quote</blockquote>