
Tracing live system calls is often the fastest way to catch the process, file, or network event that ordinary metrics miss. You can install Sysdig on Debian to inspect that activity in real time, whether you are debugging an application, watching container behavior, or investigating a host for suspicious changes.
Sysdig’s official APT repository works on Debian 13 (Trixie), Debian 12 (Bookworm), and Debian 11 (Bullseye). It also includes csysdig, the matching text interface, along with update, removal, and troubleshooting paths for the current 0.41.x release.
Prepare Debian Before Installing Sysdig
Start with fresh package metadata so Debian resolves the Sysdig dependencies against your current system state:
sudo apt update && sudo apt upgradeThese commands use
sudofor tasks that need root privileges. If your account is not in the sudoers file yet, follow the guide on how to add a user to sudoers on Debian.
Install Sysdig on Debian
Debian 12 currently carries sysdig 0.29.3-1+b1 in its default APT sources, while Debian 11 and Debian 13 currently do not show a default candidate. Sysdig’s official repository delivers the newer 0.41.x build across all three supported Debian releases, so begin by installing the required packages.
Desktop Debian systems may already have some of these packages, but minimal and server installs usually need the full list:
sudo apt install ca-certificates curl gpg ncurses-term dkms -ycurl downloads the repository key, gpg converts it into APT’s keyring format, ca-certificates validates the HTTPS connection, ncurses-term helps csysdig avoid common terminal-definition errors such as xterm-256color, and dkms rebuilds Sysdig’s scap module when your kernel changes. The -y flag accepts APT’s confirmation prompt automatically, and the guide on how to use the curl command in Linux explains the download flags used below.
Import the Sysdig GPG Key on Debian
Download the ASCII-armored Sysdig key and store the converted keyring file in /usr/share/keyrings/ for APT:
curl -fsSL https://download.sysdig.com/DRAIOS-GPG-KEY.public | sudo gpg --dearmor -o /usr/share/keyrings/sysdig.gpgThe sudo gpg --dearmor -o form writes the keyring file directly as root, which is more reliable than a plain shell redirect into a protected directory.
Add the Sysdig Repository on Debian
Create a DEB822 .sources file that points APT to Sysdig’s stable Debian repository:
printf '%s\n' \
  'Types: deb' \
  'URIs: https://download.sysdig.com/stable/deb' \
  "Suites: stable-$(dpkg --print-architecture)/" \
  'Signed-By: /usr/share/keyrings/sysdig.gpg' \
  | sudo tee /etc/apt/sources.list.d/sysdig.sources > /dev/null
This DEB822 file uses a trailing slash in
Suites:because Sysdig publishes a flat repository layout without separate components. Thedpkg --print-architecturesubstitution fills in your Debian architecture automatically, such asamd64on a standard 64-bit Debian install, andsudo teewrites the file as root because a plain shell redirect would not.
Refresh APT for the Sysdig Repository
Refresh APT so Debian reads the new Sysdig source:
sudo apt updateThe Sysdig repository appears in the output as new metadata lines similar to these:
Get:1 https://download.sysdig.com/stable/deb stable-amd64/ InRelease [1,390 B]
Get:2 https://download.sysdig.com/stable/deb stable-amd64/ Packages [52.5 kB]
Verify the Sysdig Repository on Debian
Confirm that APT now prefers the Sysdig package from the official repository:
apt-cache policy sysdigExpected output showing the Sysdig repository as source:
sysdig:
  Installed: (none)
  Candidate: 0.41.x
  Version table:
     0.41.x 500
        500 https://download.sysdig.com/stable/deb stable-amd64/ Packages
Install Sysdig and Matching Linux Headers on Debian
Install Sysdig with the headers that match your running kernel so DKMS can build the scap module immediately:
sudo apt install linux-headers-$(uname -r) sysdig -ylinux-headers-$(uname -r) expands to the exact header package for the kernel you are running. During installation, Sysdig builds the scap DKMS module automatically, and that module is rebuilt again when you install a newer kernel later.
A successful install ends with DKMS building and installing the module:
Setting up sysdig (0.41.4) ...
Loading new scap-8.1.0+driver DKMS files...
Building initial module for 6.x.x-amd64
Done.

scap.ko:
 - Installation
   - Installing to /lib/modules/6.x.x-amd64/updates/dkms/
Verify Sysdig on Debian
Check the main binary and confirm that the package also placed csysdig on your system:
sysdig --version
command -v csysdig
Expected output:
sysdig version 0.41.4
/usr/bin/csysdig
The official sysdig package also installs csysdig, so you do not need a second package to use the text interface.
Use Sysdig on Debian
Sysdig can trace raw system activity with enough detail to explain what a process touched, which network sockets it opened, and how its behavior changed over time. These examples cover a practical starting set of filters and chisels.
Run Basic Sysdig Monitoring Commands
To get started, first explore these fundamental commands that help you understand overall system activity.
List Sysdig Filter Fields
To understand what data Sysdig can capture, display all available filter fields:
sysdig -lThis outputs hundreds of available filter fields organized by category. Here is a sample of the event-related fields:
-------------------------------
Field Class:                  evt (All event types)
Description:                  These fields can be used for all event types
Event Sources:                syscall

evt.num                       event number.
evt.time                      event timestamp as a time string that includes the nanosecond part.
evt.time.s                    event timestamp as a time string with no nanoseconds.
evt.datetime                  event timestamp as a time string that includes the date.
...
Common fields include proc.name (process name), fd.name (file descriptor name), evt.type (event type like read, write, open), and container.name (Docker container name). As a result, you can use these fields to build targeted queries for specific analysis tasks.
Monitor System Activity with Sysdig
Similarly, you can monitor real-time CPU activity using the topprocs_cpu chisel. Chisels are pre-built Lua scripts that process Sysdig’s raw event stream into useful summaries:
sudo sysdig -c topprocs_cpuThis displays the processes consuming the most CPU in a continuously updating view, helping identify resource-intensive applications. Press Ctrl+C to stop monitoring. For basic process monitoring without kernel-level detail, install htop on Debian as a lightweight alternative.
List Available Sysdig Chisels
To see all available chisels organized by category, run:
sysdig -clExample output showing chisel categories:
Category: CPU Usage
-------------------
topcontainers_cpu    Top containers by CPU usage
topprocs_cpu         Top processes by CPU usage

Category: Errors
----------------
topfiles_errors      Top files by number of errors
topprocs_errors      Top processes by number of errors

Category: Net
-------------
spy_ip               Show the data exchanged with the given IP address
topconns             Top network connections by total bytes
topprocs_net         Top processes by network I/O

Category: Security
------------------
spy_users            Display interactive user activity
Each chisel serves a specific monitoring purpose. For instance, spy_users tracks all commands executed by users, making it particularly valuable for security auditing.
Filter Sysdig Events by Process Name
Beyond summary views, Sysdig also works well when you need raw events from one service. For example, monitor every system call from an Nginx worker after you install Nginx on Debian:
sudo sysdig proc.name=nginxThis captures every system call made by Nginx processes, including file reads, network operations, and memory allocations. The output streams in real time, showing the direction (> for entry, < for exit), timestamp, process name, and syscall details.
Filter Sysdig Events by Container Name
If you run containers, Sysdig can filter events to a specific workload after you install Docker on Debian:
sudo sysdig container.name=my_containerReplace my_container with your actual container name. This approach is particularly useful for debugging container-specific issues, since you see only events from processes inside that container rather than system-wide noise.
Run Advanced Sysdig Monitoring Commands
In addition to basic monitoring, Sysdig includes specialized chisels for file I/O analysis, network monitoring, and security investigations. These provide deeper insights than standard Linux tools.
Monitor File I/O with Sysdig
The spy_file chisel shows files being accessed, the processes accessing them, and the actual data being read or written:
sudo sysdig -c spy_fileThis is particularly useful for understanding what configuration files an application reads during startup or what log files it writes to. Additionally, you can filter to a specific file:
sudo sysdig -c spy_file /etc/passwdAnalyze Network Connections with Sysdig
Likewise, you can display active network connections with the netstat chisel:
sudo sysdig -c netstatOutput includes source and destination IP addresses, ports, and connection state for all active connections. Similarly, for network traffic analysis, the topconns chisel shows connections sorted by bytes transferred:
sudo sysdig -c topconnsCreate Custom Sysdig Filtered Views
Furthermore, you can combine chisels with filters to create focused monitoring views for specific processes or events.
Create a Sysdig CPU Filter View
To create a custom view that displays the CPU usage of processes, use the following command:
sudo sysdig -c topprocs_cpu "evt.type=execve and proc.name=my_process"Replace my_process with the process name you want to monitor. The filter limits output to only matching processes while the chisel displays CPU consumption rankings. Like all capture commands, this requires root privileges.
Use csysdig on Debian
csysdig gives you the same event stream in a navigable terminal interface, which is useful when you want to explore process and network activity live instead of reading a long capture scroll. It feels closer to htop, but the data still comes from Sysdig’s syscall tracing engine.
Launch csysdig on Debian
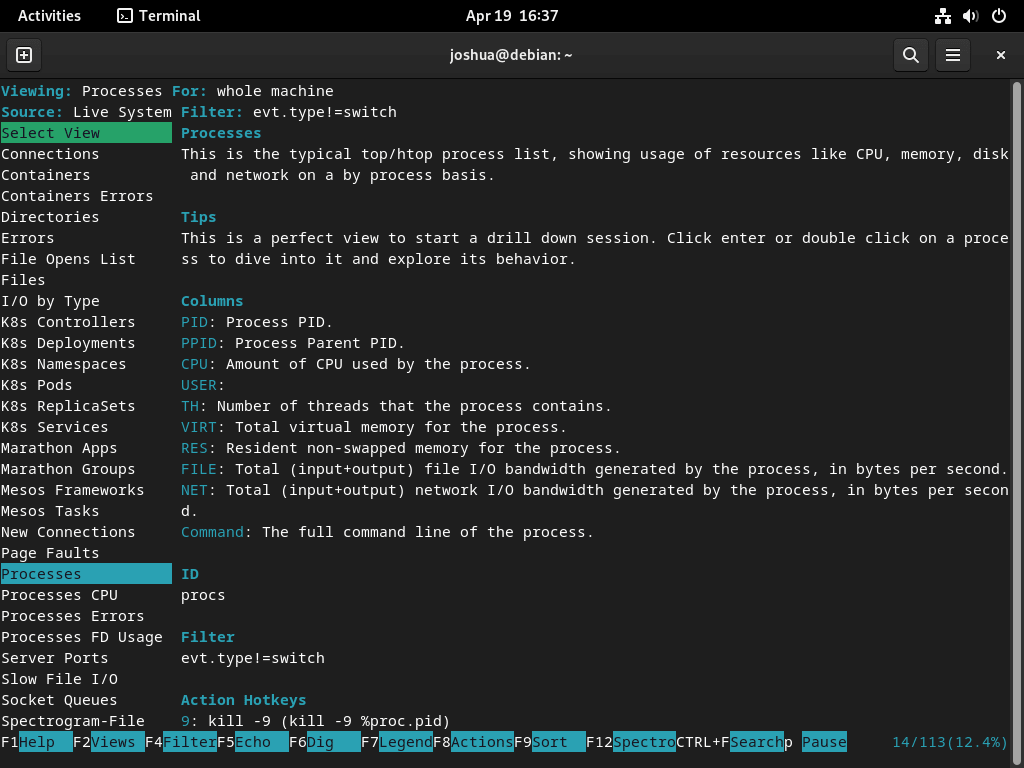
To begin, launch csysdig with root privileges to access all system events:
sudo csysdigThe interface opens showing the default Processes view. From here, use keyboard shortcuts to navigate between views and filter data.
Navigate csysdig Views on Debian
Once csysdig is running, press F2 or type : followed by the view name to switch between built-in views:
- Processes: Displays a list of running processes and their resource usage. (Shortcut: :processes)
- Connections: Shows active network connections, including source and destination IP addresses, ports, and connection state. (Shortcut: :connections)
- Errors: Highlights system errors and exceptions. (Shortcut: :errors)
- Containers: Lists running containers and their resource usage. (Shortcut: :containers)
Learn csysdig Keyboard Shortcuts
The following shortcuts help you navigate csysdig efficiently:
- F1 or h: Display the help menu, providing an overview of available commands and shortcuts.
- F2 or v: Switch between available views.
- F4 or l: Apply a filter to the current view. For example, you can filter processes by their name or containers by their ID.
- F5 or s: Sort the current view by a specific column.
- F6 or a: Add or remove columns from the current view.
- Esc or q: Quit
csysdigor close the current menu.
Create Custom csysdig Views on Debian
Additionally, you can create custom views to focus on specific metrics:
- Press F2 or type :addview to open the “Add View” menu.
- Enter a name for your custom view.
- Define the columns you want to include in your view by typing the respective column names.
- Add a filter to your custom view by pressing F4 and entering the filter criteria.
- Save your custom view by pressing Enter.
After saving, switch to your custom view with F2 or by typing :your_view_name.
Troubleshoot Sysdig on Debian
Most Sysdig problems on Debian come from the kernel module path or from running a capture without elevated privileges. These checks cover both cases.
Fix Sysdig Kernel Module Errors on Debian
If Sysdig reports that the probe cannot load, first make sure the headers for your running kernel are installed:
sudo apt install linux-headers-$(uname -r)Then load Sysdig’s tested DKMS module name directly:
sudo modprobe scapA successful modprobe run returns no output. If the module still does not load, switch to Sysdig’s eBPF path instead of the DKMS module:
sudo sysdig --modern-bpf -cl | sed -n '1,8p'Expected output:
Category: Application
---------------------
httplog.lua     HTTP requests log
httptop.lua     Top HTTP requests
memcachelog.lua memcached requests log
The --modern-bpf option uses the kernel’s built-in eBPF support and works on kernels 5.8 and newer.
Fix Sysdig Permission Errors on Debian
Sysdig needs elevated privileges for live captures, so a regular shell will trigger permission errors. Re-run the command with sudo:
sudo sysdig -c topprocs_cpuA live list of top CPU consumers confirms that Sysdig can read events again. The same rule applies to csysdig, so launch it with sudo csysdig.
Update or Remove Sysdig on Debian
Keep Sysdig current with a targeted package upgrade, then remove the package and repository files cleanly if you no longer need them.
Update Sysdig on Debian
When new versions are released, you can update only Sysdig without upgrading other packages:
sudo apt update && sudo apt install --only-upgrade sysdig -yIf you prefer to upgrade the whole system at the same time, use the normal Debian upgrade path:
sudo apt update && sudo apt upgrade -yConfirm the installed version after either update path:
sysdig --versionExpected output:
sysdig version 0.41.x
Remove Sysdig on Debian
Remove the package first, then delete the repository files you added for this method.
Remove the Sysdig Package on Debian
Start by removing the package itself:
sudo apt remove sysdig -yThis removal also deletes the scap DKMS module automatically. Leave dkms, linux-headers-$(uname -r), and ncurses-term installed unless you know nothing else on the system needs them.
Remove the Sysdig GPG Key on Debian
Remove the keyring file that APT used to trust the Sysdig repository:
sudo rm -f /usr/share/keyrings/sysdig.gpgRemove the Sysdig Repository on Debian
Delete the Sysdig .sources file next:
sudo rm -f /etc/apt/sources.list.d/sysdig.sourcesVerify Sysdig Removal on Debian
Refresh APT and confirm that the package is no longer installed:
sudo apt update
apt-cache policy sysdig
Expected output after successful removal:
sysdig:
  Installed: (none)
  Candidate: (none)
  Version table:
Debian 12 may still show
Candidate: 0.29.3-1+b1from the default APT sources after repository cleanup. Debian 11 and Debian 13 currently returnCandidate: (none). If you still see a 0.41.x candidate, the Sysdig repository file or key likely remains in place.
Sysdig on Debian FAQ
Yes. The official sysdig package also installs csysdig, so you can launch the interactive interface with sudo csysdig after the main package is installed.
Use the official Sysdig repository if you want the current 0.41.x release across Debian 13, 12, and 11. Debian 12 still carries sysdig 0.29.3-1+b1 in its default APT sources, while Debian 11 and Debian 13 currently do not show a default candidate.
Yes. Sysdig 0.35.0 and newer support the eBPF driver, so sudo sysdig --modern-bpf gives you a fallback when the scap DKMS module does not load.
Conclusion
Sysdig is ready on Debian with the current upstream package, the csysdig interface, and an eBPF fallback if the kernel module path gives you trouble. If container tracing is next, install Docker on Debian; for login protection on exposed services, install Fail2Ban on Debian.

Formatting tips for your comment
You can use basic HTML to format your comment. Useful tags currently allowed in published comments:
<code>command</code>command<strong>bold</strong><em>italic</em><blockquote>quote</blockquote>