
When you need a lightweight way to see which hosts and services are consuming bandwidth, install Darkstat on Ubuntu and expose a small web dashboard without deploying a heavier monitoring stack. It works well on home labs, routers, and headless Ubuntu systems where you want quick visibility into traffic on one interface.
Darkstat is packaged in Ubuntu’s Universe repository on 26.04, 24.04, and 22.04, so the same APT workflow handles installation, configuration, dashboard access, updates, and removal.
Update Ubuntu Before Installing Darkstat
Refresh your package lists first so APT sees the current package metadata from your configured Ubuntu repositories.
sudo apt update && sudo apt upgradeThese commands use
sudofor package management tasks. If your account does not have sudo access yet, follow the guide on add a new user to sudoers on Ubuntu first.
Install Darkstat on Ubuntu Using APT
Darkstat lives in Ubuntu’s Universe repository. Standard desktop installs usually have Universe enabled already, but some server or minimal images may need it turned on before the package appears.
If APT returns
Unable to locate package darkstat, enable Universe first with the guide on enable Universe and Multiverse in Ubuntu, then rerun the install command.
sudo apt install -y darkstatThe -y flag tells APT to accept the confirmation prompt automatically, which keeps the install flow copy-and-paste friendly.
Verify the package state with apt-cache policy so you can confirm both the installed revision and the Ubuntu repository that provided it.
apt-cache policy darkstatdarkstat:
Installed: 3.0.722-1
Candidate: 3.0.722-1
Version table:
*** 3.0.722-1 500
500 http://au.archive.ubuntu.com/ubuntu resolute/universe amd64 Packages
100 /var/lib/dpkg/status
Ubuntu 24.04 reports 3.0.719-1.1build2, and Ubuntu 22.04 reports 3.0.719-1build1, but the install flow stays the same across all three supported Ubuntu LTS releases.
Configure Darkstat on Ubuntu
Darkstat only becomes useful after you point it at a real network interface and restart the service with settings that match your Ubuntu system.
Show Network Interfaces for Darkstat on Ubuntu
List the available interfaces first so INTERFACE matches the device Ubuntu is actually using.
ip -brief linklo UNKNOWN 00:00:00:00:00:00 <LOOPBACK,UP,LOWER_UP> enp0s3 UP 08:00:27:52:d9:70 <BROADCAST,MULTICAST,UP,LOWER_UP>
Use the name from the first column. On many Ubuntu systems that will be something like enp0s3, ens33, or wlp2s0 instead of the older eth0 pattern.
Edit Darkstat Configuration on Ubuntu
Open the packaged config file and replace the placeholder values with settings that match your system.
sudo nano /etc/darkstat/init.cfgSet or uncomment these lines inside /etc/darkstat/init.cfg:
START_DARKSTAT=yes
INTERFACE="-i enp0s3"
PORT="-p 667"
Replace enp0s3 with your actual interface name. Setting START_DARKSTAT=yes keeps Ubuntu 24.04 and 22.04 happy, and the line is harmless on Ubuntu 26.04, where the native systemd unit still reads the rest of init.cfg directly.
The explicit PORT="-p 667" line keeps the dashboard URL consistent across supported Ubuntu releases. Ubuntu 24.04 and 22.04 still comment port 666 in the sample config, while Ubuntu 26.04 comments 667. If you want the dashboard reachable only from the local machine, add BINDIP="-b 127.0.0.1" as well.
Start Darkstat on Ubuntu
Enable the service for future boots, then restart it so Darkstat reloads the edited configuration right away.
sudo systemctl enable darkstat
sudo systemctl restart darkstat
Verify that the service is running before you move on to the dashboard URL.
systemctl status darkstat● darkstat.service - darkstat monitoring system
Loaded: loaded (/usr/lib/systemd/system/darkstat.service; enabled; preset: enabled)
Active: active (running)
On Ubuntu 24.04 and 22.04, the service description comes from a generated SysV unit, but the success state is still the same: Active: active (running). Before you edit init.cfg, those older releases can show active (exited) even though the dashboard is not serving traffic yet, so do not treat that pre-configuration state as success.
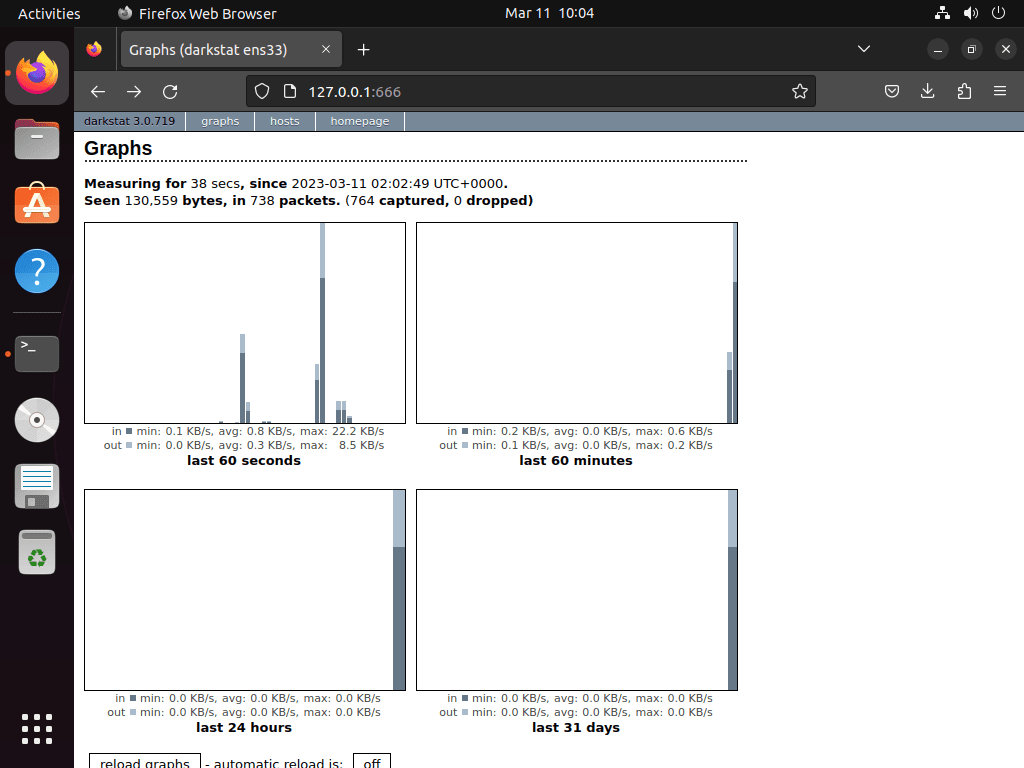
Access the Darkstat Dashboard on Ubuntu
This configuration serves the Darkstat dashboard on TCP port 667. Open http://server-ip:667/ in a browser on the same network, replacing server-ip with the Ubuntu system’s address, for example http://192.168.1.100:667/.
From the Ubuntu host itself, use the curl command in Linux to confirm that Darkstat is answering locally before you test remote browser access.
curl --silent --show-error --head --max-time 5 http://127.0.0.1:667/HTTP/1.1 200 OK Server: darkstat/3.0.722
Ubuntu 24.04 and 22.04 report Server: darkstat/3.0.719, but the key success state stays the same: HTTP/1.1 200 OK.
Darkstat’s web UI is plain HTTP and does not add authentication on its own. Keep it on a trusted network, bind it to localhost, or place it behind another access-controlled layer before exposing it more widely.
If UFW is enabled and you want to reach the dashboard from another machine, follow the guide on configure UFW on Ubuntu and allow TCP port 667. If the dashboard should stay local to the host, keep the firewall closed and use BINDIP="-b 127.0.0.1" instead.
Update or Remove Darkstat on Ubuntu
Darkstat comes from Ubuntu’s standard repositories, so the maintenance workflow stays simple.
Update Darkstat on Ubuntu
Use APT’s single-package upgrade path when you want the newest Darkstat package available for your Ubuntu release without upgrading unrelated software at the same time. The --only-upgrade flag tells APT to refresh Darkstat only if the package is already installed.
sudo apt update && sudo apt install --only-upgrade -y darkstatRemove Darkstat on Ubuntu
Remove the package and its no-longer-needed dependencies if you no longer want Darkstat on the system.
sudo apt remove -y darkstat
sudo apt autoremove -y
Verify the removal with apt-cache policy. This is more reliable than which or command -v in the same shell session because the shell can still cache a previously found binary path after the package is removed.
apt-cache policy darkstatdarkstat:
Installed: (none)
Candidate: 3.0.722-1
Version table:
3.0.722-1 500
500 http://au.archive.ubuntu.com/ubuntu resolute/universe amd64 Packages
100 /var/lib/dpkg/status
Ubuntu 24.04 and 22.04 show different candidate revisions, but the key success state stays the same: Installed: (none).
Package removal leaves /etc/darkstat/init.cfg and any saved traffic database such as /var/lib/darkstat/darkstat.db behind. Darkstat does not create a standard per-user config tree in a basic Ubuntu install, so the leftover cleanup lives in /etc and /var/lib.
Only run the next commands if you want to delete the saved traffic history and the remaining system files. Skip them if you plan to reinstall Darkstat and keep the same configuration later.
sudo apt purge -y darkstat
sudo rm -rf /var/lib/darkstat
The purge step removes /etc/darkstat, and the manual removal clears /var/lib/darkstat when a saved darkstat.db file kept that directory from disappearing automatically.
Verify that the remaining config and database paths are gone after the cleanup step.
sudo ls -ld /etc/darkstat /var/lib/darkstat 2>/dev/null || echo "Darkstat config and database removed"Darkstat config and database removed
Darkstat on Ubuntu FAQ
On Ubuntu 24.04 and 22.04, the SysV-generated service can report active (exited) until you set START_DARKSTAT=yes, choose a real interface in INTERFACE, and restart the service. The real success state after configuration is Active: active (running).
The configuration in this article sets PORT="-p 667" so the dashboard stays at http://server-ip:667/ across Ubuntu 26.04, 24.04, and 22.04. Ubuntu 24.04 and 22.04 still ship a sample init.cfg line that comments 666, so set the port explicitly if you want one consistent URL.
Yes. Darkstat captures traffic locally and serves its dashboard over HTTP, so you can configure it over SSH and then open the dashboard from another browser. Keep the port restricted to trusted networks or bind it to 127.0.0.1 if you do not need remote access.
No. Darkstat’s main interface is the embedded web dashboard rather than a curses-style terminal display. If you want live traffic in a shell session, use a terminal-focused monitor such as Bmon or Nmon instead.
Conclusion
Darkstat is installed and configured on Ubuntu with a browser-accessible traffic dashboard on port 667, which gives you quick visibility into bandwidth use without deploying a full monitoring stack. If you also want terminal views, install Bmon on Ubuntu for live interface stats or install nmon on Ubuntu for broader performance monitoring.

Formatting tips for your comment
You can use basic HTML to format your comment. Useful tags currently allowed:
<code>command</code>command<strong>bold</strong><em>italic</em><blockquote>quote</blockquote>