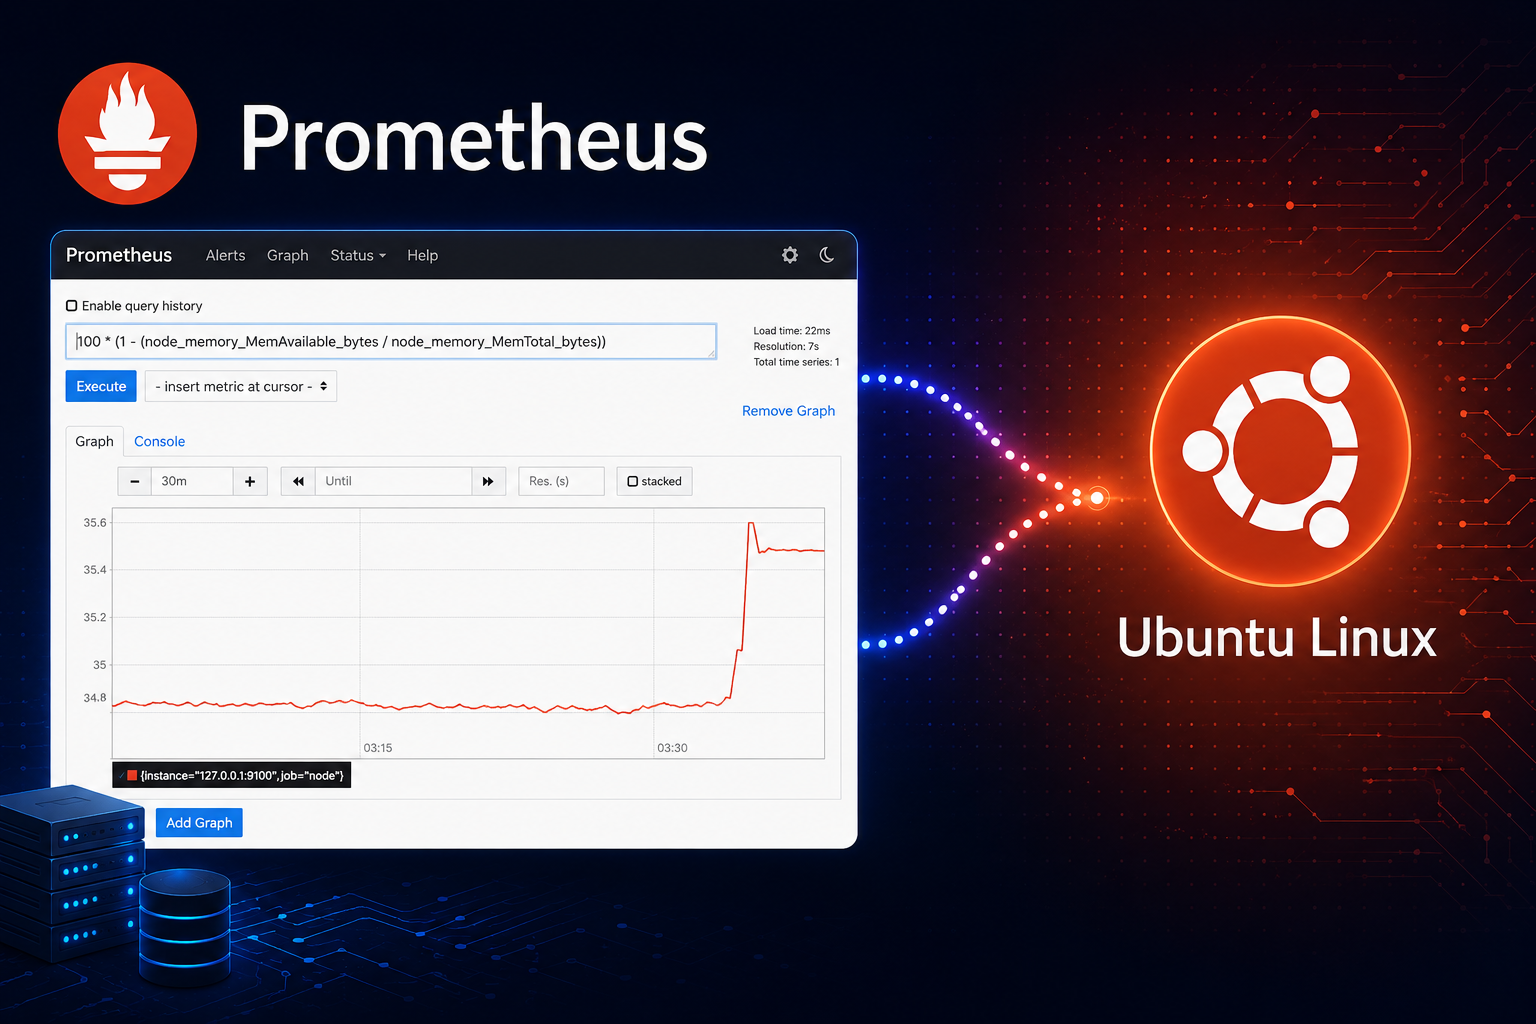
Prometheus is a metrics collection and alerting system used to scrape time series data from applications, exporters, and infrastructure targets. On Ubuntu, the lowest-maintenance installation path is the Ubuntu package, while the upstream release asset is useful when you need a newer Prometheus branch than your Ubuntu release provides.
This guide covers both paths on Ubuntu 26.04 LTS, 24.04 LTS, and 22.04 LTS. The package method uses Ubuntu’s repositories and systemd unit, and the upstream method installs the official Prometheus binaries with checksum verification. Both methods keep the Prometheus web interface bound to 127.0.0.1:9090 by default so a new installation is not exposed on the network.
Choose a Prometheus Installation Method
Pick one method before installing Prometheus. Do not install the Ubuntu package and the upstream binaries on the same system, because both methods provide the prometheus and promtool commands and manage the same service name.
| Method | Best for | Tradeoffs |
|---|---|---|
| Ubuntu APT package | Most servers and routine Ubuntu maintenance. | Uses Ubuntu security updates and package ownership. The packaged Prometheus version depends on your Ubuntu release. |
| Upstream release asset | Systems that need the latest stable Prometheus release from the project. | Uses official upstream binaries and SHA256 verification, but updates are your responsibility through the helper script. |
Check the package available for your Ubuntu release before choosing the APT method:
apt-cache policy prometheusFor a concrete version comparison, Ubuntu repository candidates were Prometheus 2.53.5 on Ubuntu 26.04, 2.45.3 on Ubuntu 24.04, and 2.31.2 on Ubuntu 22.04, while the upstream helper selected Prometheus 3.12.0 from the official GitHub release assets. Those versions will change as Ubuntu and Prometheus publish updates, so treat the command output on your system as authoritative.
Install Prometheus from Ubuntu APT
Use the APT method when you want Ubuntu to manage the package, service file, default configuration, and future security updates. The --no-install-recommends option keeps the install focused on the Prometheus server; without it, Ubuntu can also install recommended exporter packages that are not required for this basic setup.
sudo apt update
sudo apt install --no-install-recommends prometheus
Verify that the server and promtool command are present:
prometheus --version
promtool --version
systemctl is-active prometheus
Because this install skips recommended exporters, replace Ubuntu’s sample scrape configuration with a minimal self-scrape. This avoids a default node-exporter target showing as down when prometheus-node-exporter is not installed:
sudo cp /etc/prometheus/prometheus.yml /etc/prometheus/prometheus.yml.bak
sudo tee /etc/prometheus/prometheus.yml >/dev/null <<'EOF'
global:
  scrape_interval: 15s

scrape_configs:
  - job_name: prometheus
    static_configs:
      - targets:
          - 127.0.0.1:9090
EOF
sudo promtool check config /etc/prometheus/prometheus.yml
The Ubuntu package starts Prometheus automatically. Bind the web interface to localhost unless you have already planned authentication, a reverse proxy, VPN access, or source-restricted firewall rules. The Ubuntu package reads startup arguments from /etc/default/prometheus, so set the listen address there and restart the service:
sudo cp /etc/default/prometheus /etc/default/prometheus.bak
sudo sed -i 's|^ARGS=.*|ARGS="--web.listen-address=127.0.0.1:9090"|' /etc/default/prometheus
sudo systemctl daemon-reload
sudo systemctl restart prometheus
Confirm that the service is active and listening only on localhost:
systemctl is-enabled prometheus
systemctl is-active prometheus
sudo ss -ltnp | grep ':9090'
enabled
active
LISTEN 0 4096 127.0.0.1:9090 0.0.0.0:* users:(("prometheus",pid=22538,fd=6))
Install Prometheus from the Upstream Release Asset
Use the upstream method when the Ubuntu package is too old for your deployment. The helper below queries the official Prometheus releases, ignores draft and prerelease tags, selects the highest stable semantic version, downloads the matching Linux asset for the current architecture, verifies it against sha256sums.txt, and installs a localhost-bound systemd service.
The upstream helper maps x86_64 to the linux-amd64 asset and also maps common upstream asset names such as arm64, armv7, ppc64le, s390x, and riscv64. Confirm that your architecture appears on the Prometheus download page before using this method on non-amd64 systems.
Install the tools the helper uses for downloads, TLS certificate validation, and release metadata parsing:
sudo apt update
sudo apt install curl ca-certificates python3
Create the updater helper under /usr/local/bin:
sudo tee /usr/local/bin/prometheus-upstream-install >/dev/null <<'EOF'
#!/usr/bin/env bash
set -Eeuo pipefail

if [ "${EUID}" -ne 0 ]; then
  echo "Run this installer with sudo." >&2
  exit 1
fi

if dpkg-query -W -f='${db:Status-Abbrev}' prometheus 2>/dev/null | grep -q '^ii'; then
  echo "The Ubuntu prometheus package is installed. Remove it before using the upstream installer." >&2
  exit 1
fi

case "$(uname -m)" in
  x86_64) prom_arch="amd64" ;;
  aarch64|arm64) prom_arch="arm64" ;;
  armv7l) prom_arch="armv7" ;;
  armv6l) prom_arch="armv6" ;;
  i386|i686) prom_arch="386" ;;
  ppc64le) prom_arch="ppc64le" ;;
  s390x) prom_arch="s390x" ;;
  riscv64) prom_arch="riscv64" ;;
  *) echo "Unsupported architecture: $(uname -m)" >&2; exit 1 ;;
esac

work_dir="$(mktemp -d)"
trap 'rm -rf "$work_dir"' EXIT
releases_json="$work_dir/releases.json"

curl -fsSL --retry 3 --retry-delay 2 \
  -H "Accept: application/vnd.github+json" \
  "https://api.github.com/repos/prometheus/prometheus/releases?per_page=50" \
  -o "$releases_json"

version="$(python3 - "$releases_json" <<'PY'
import json, re, sys
with open(sys.argv[1], encoding='utf-8') as fh:
    releases = json.load(fh)
versions = []
for release in releases:
    if release.get('draft') or release.get('prerelease'):
        continue
    tag = release.get('tag_name', '').lstrip('v')
    if re.fullmatch(r'\d+\.\d+\.\d+', tag):
        versions.append((tuple(map(int, tag.split('.'))), tag))
if not versions:
    raise SystemExit('No stable Prometheus release found')
print(max(versions)[1])
PY
)"

installed_version=""
if [ -x /usr/local/bin/prometheus ]; then
  installed_version="$(/usr/local/bin/prometheus --version 2>/dev/null | awk '/prometheus, version/{print $3; exit}')"
fi

if [ "$installed_version" = "$version" ] && [ -f /etc/systemd/system/prometheus.service ] && systemctl is-active --quiet prometheus; then
  echo "Prometheus $version is already installed from the upstream asset."
  echo "prometheus.service is active."
  exit 0
fi

asset="prometheus-${version}.linux-${prom_arch}.tar.gz"
base_url="https://github.com/prometheus/prometheus/releases/download/v${version}"
archive="$work_dir/$asset"
sums="$work_dir/sha256sums.txt"

curl -fsSL --retry 3 --retry-delay 2 -o "$archive" "$base_url/$asset"
curl -fsSL --retry 3 --retry-delay 2 -o "$sums" "$base_url/sha256sums.txt"
(
  cd "$work_dir"
  grep "  $asset$" sha256sums.txt | sha256sum -c -
)

tar -xzf "$archive" -C "$work_dir"
release_dir="$work_dir/prometheus-${version}.linux-${prom_arch}"

groupadd --system prometheus 2>/dev/null || true
if ! id -u prometheus >/dev/null 2>&1; then
  useradd --system --no-create-home --home-dir /var/lib/prometheus --shell /usr/sbin/nologin --gid prometheus prometheus
fi

install -d -m 0755 -o root -g root /etc/prometheus
install -d -m 0755 -o prometheus -g prometheus /var/lib/prometheus
install -m 0755 "$release_dir/prometheus" /usr/local/bin/prometheus
install -m 0755 "$release_dir/promtool" /usr/local/bin/promtool

if [ ! -f /etc/prometheus/prometheus.yml ]; then
  cat > /etc/prometheus/prometheus.yml <<'PROMYML'
global:
  scrape_interval: 15s

scrape_configs:
  - job_name: prometheus
    static_configs:
      - targets:
          - 127.0.0.1:9090
PROMYML
fi
chown root:prometheus /etc/prometheus/prometheus.yml
chmod 0640 /etc/prometheus/prometheus.yml

cat > /etc/systemd/system/prometheus.service <<'SERVICE'
[Unit]
Description=Prometheus Monitoring System
Documentation=https://prometheus.io/docs/introduction/overview/
Wants=network-online.target
After=network-online.target

[Service]
User=prometheus
Group=prometheus
Type=simple
ExecStart=/usr/local/bin/prometheus \
  --config.file=/etc/prometheus/prometheus.yml \
  --storage.tsdb.path=/var/lib/prometheus \
  --web.listen-address=127.0.0.1:9090
ExecReload=/bin/kill -HUP $MAINPID
Restart=on-failure
RestartSec=5s

[Install]
WantedBy=multi-user.target
SERVICE

/usr/local/bin/promtool check config /etc/prometheus/prometheus.yml
systemd-analyze verify /etc/systemd/system/prometheus.service
systemctl daemon-reload
systemctl enable prometheus
systemctl restart prometheus
systemctl is-active --quiet prometheus
/usr/local/bin/prometheus --version | head -n 1
echo "Prometheus $version installed from $asset"
EOF
Make the helper executable, check its Bash syntax, and run it once:
sudo chmod 0755 /usr/local/bin/prometheus-upstream-install
sudo bash -n /usr/local/bin/prometheus-upstream-install
sudo prometheus-upstream-install
A successful run shows the checksum result, the validated configuration, and the installed Prometheus version. The exact version will differ when Prometheus publishes a newer stable release.
prometheus-3.12.0.linux-amd64.tar.gz: OK
Checking /etc/prometheus/prometheus.yml
 SUCCESS: /etc/prometheus/prometheus.yml is valid prometheus config file syntax
prometheus, version 3.12.0
Prometheus 3.12.0 installed from prometheus-3.12.0.linux-amd64.tar.gz
Run the helper again whenever you want to check for a newer stable upstream release:
sudo prometheus-upstream-installPrometheus 3.12.0 is already installed from the upstream asset. prometheus.service is active.
Verify Prometheus on Ubuntu
Use the same verification checks for either installation method. The systemctl commands confirm that systemd enabled and started the service:
systemctl is-enabled prometheus
systemctl is-active prometheus
Check the readiness endpoint from the Ubuntu host itself. The exact wording can differ by Prometheus branch, but a healthy service returns a line containing Ready:
python3 - <<'PY'
import urllib.request
print(urllib.request.urlopen("http://127.0.0.1:9090/-/ready", timeout=10).read().decode().strip())
PY
Prometheus Server is Ready.
Then verify the listener. A localhost-only installation should show 127.0.0.1:9090, not *:9090 or 0.0.0.0:9090:
sudo ss -ltnp | grep ':9090'From a desktop session on the same Ubuntu machine, open http://127.0.0.1:9090 in your browser. For a headless server, use an SSH tunnel instead of exposing the web interface directly:
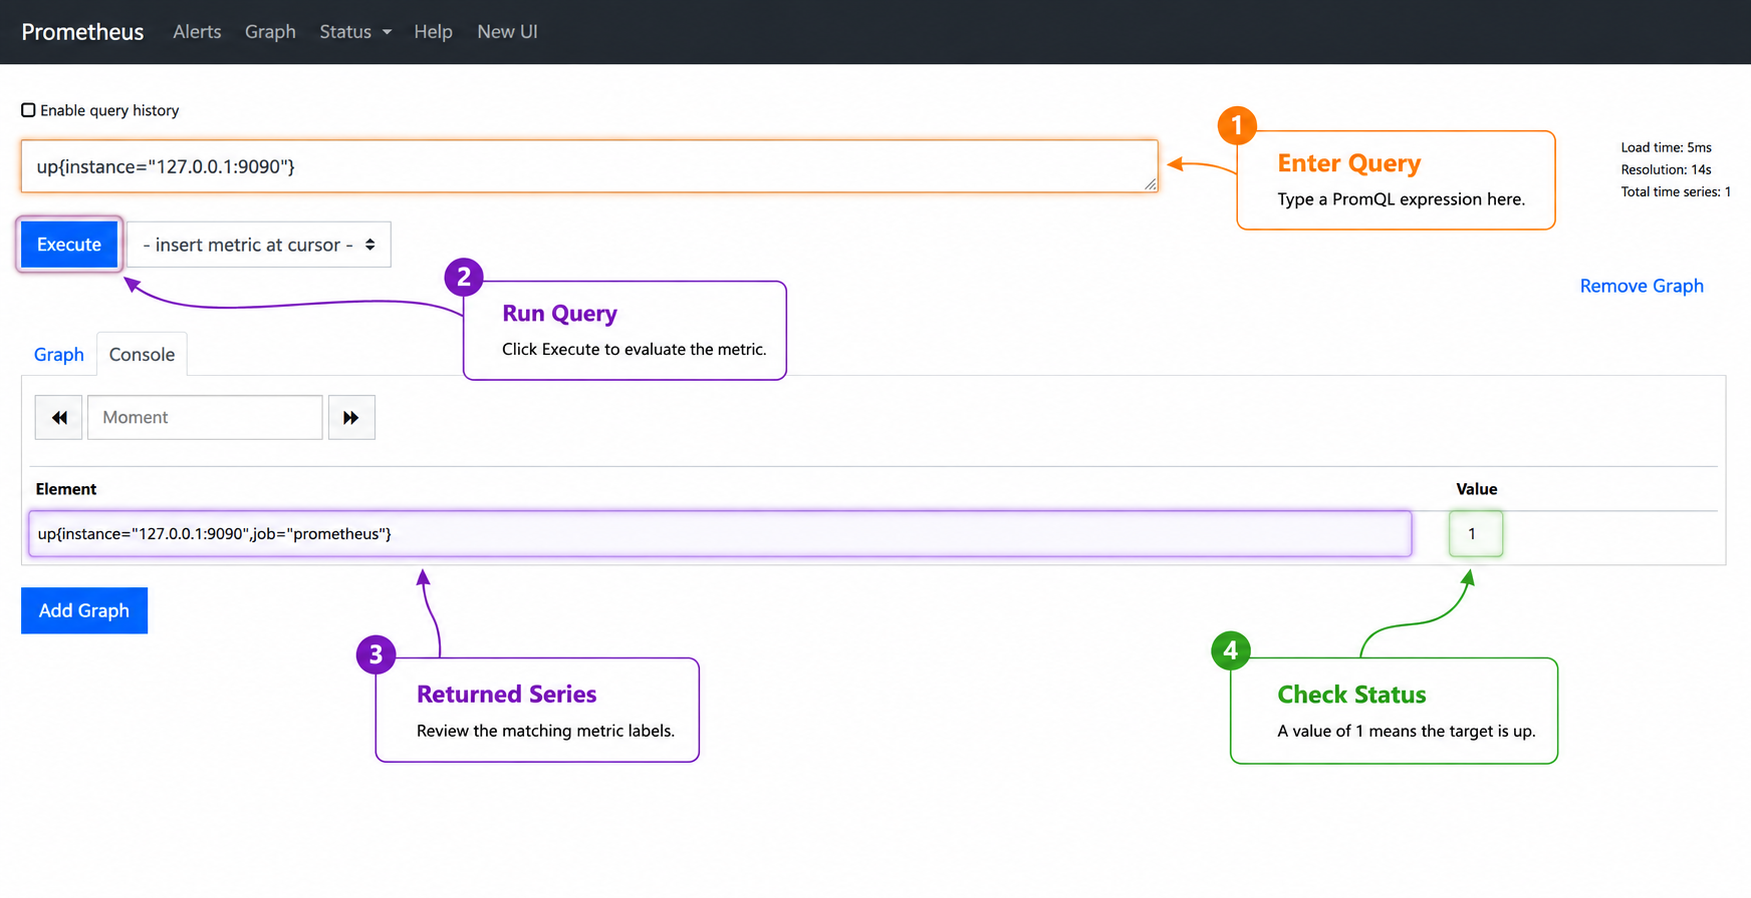
ssh -L 9090:127.0.0.1:9090 user@server-ipAfter opening Prometheus through the local browser or SSH tunnel, use the query view to run up{instance="127.0.0.1:9090"}. A healthy self-scrape returns one current series with a value of 1, which confirms Prometheus can scrape its own metrics endpoint.
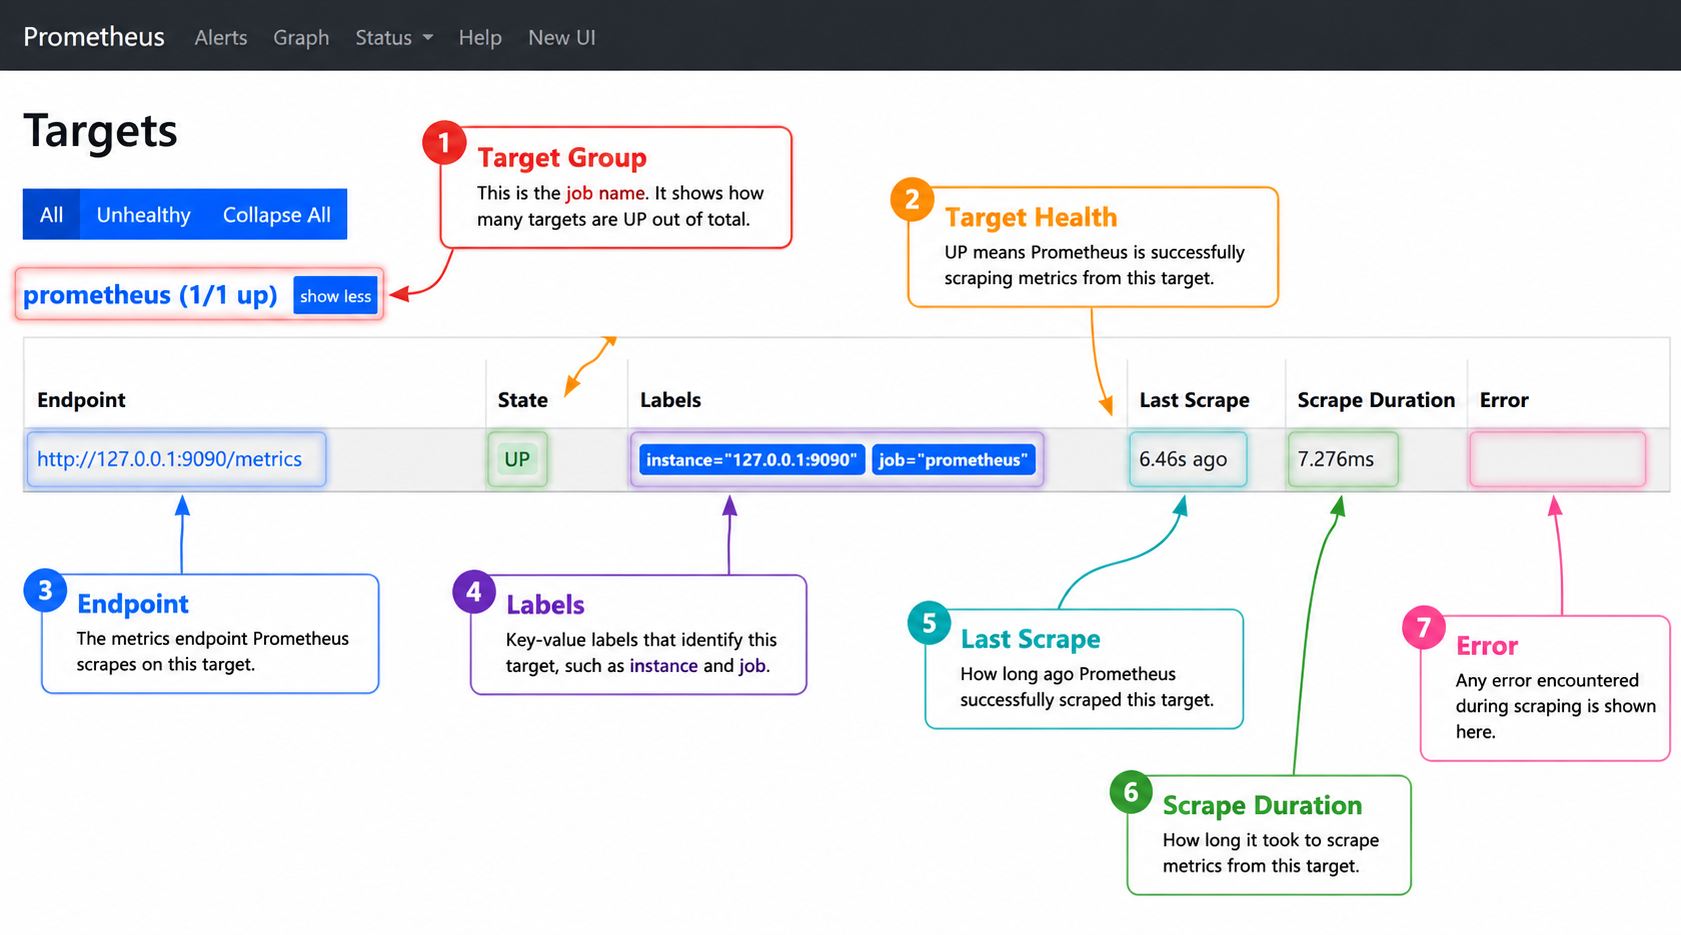
Next, open http://127.0.0.1:9090/targets. The default setup from this guide should show the prometheus job as up for http://127.0.0.1:9090/metrics. If a target appears down, fix that scrape target before adding more exporters or application jobs.
Configure Prometheus on Ubuntu
Both methods in this guide use /etc/prometheus/prometheus.yml as the main configuration file. Back up the file before changing scrape jobs:
sudo cp /etc/prometheus/prometheus.yml /etc/prometheus/prometheus.yml.bak
sudo nano /etc/prometheus/prometheus.yml
The default configuration scrapes Prometheus itself. Add other targets under scrape_configs only after the target application or exporter is actually serving metrics:
global:
  scrape_interval: 15s

scrape_configs:
  - job_name: prometheus
    static_configs:
      - targets:
          - 127.0.0.1:9090

  - job_name: app
    metrics_path: /metrics
    static_configs:
      - targets:
          - 192.0.2.50:9100
Replace 192.0.2.50:9100 with a real exporter endpoint that is already serving metrics. If you have not installed a node, application, or database exporter yet, leave only the self-scrape job so the Targets page stays healthy.
Validate the file before restarting Prometheus:
sudo promtool check config /etc/prometheus/prometheus.yml
sudo systemctl restart prometheus
If Prometheus fails after a configuration change, restore the backup and inspect the service logs with journalctl.
Control Prometheus Network Access
Prometheus is usually deployed behind a trusted network boundary, reverse proxy, or VPN. If you need remote browser access, change the bind address deliberately and restrict who can reach port 9090. Do not open port 9093 unless you have installed Alertmanager separately; Prometheus itself uses 9090 for the web UI and HTTP API.
For the Ubuntu APT package, edit /etc/default/prometheus and restart the service:
sudo sed -i 's|^ARGS=.*|ARGS="--web.listen-address=0.0.0.0:9090"|' /etc/default/prometheus
sudo systemctl restart prometheus
For the upstream systemd service, edit /etc/systemd/system/prometheus.service, change only the --web.listen-address value, then reload systemd:
sudo nano /etc/systemd/system/prometheus.service
sudo systemctl daemon-reload
sudo systemctl restart prometheus
If you use UFW on Ubuntu, prefer a source-restricted rule for an administrator workstation or VPN subnet:
sudo ufw allow from 192.0.2.10 to any port 9090 proto tcp
sudo ufw status numbered
Replace 192.0.2.10 with the real administrative source IP or subnet. Avoid broad rules such as sudo ufw allow 9090/tcp on internet-facing servers.
Update Prometheus on Ubuntu
For the APT package, update the package index and ask APT to upgrade Prometheus:
sudo apt update
sudo apt install --only-upgrade prometheus
On Ubuntu releases where promtool is packaged separately as a dependency, APT handles the dependency during normal upgrades.
For the upstream method, rerun the helper. It upgrades Prometheus when a newer stable release is available and exits cleanly when the installed version is already current:
sudo prometheus-upstream-installRemove Prometheus from Ubuntu
Use the removal commands that match your installation method. Back up /etc/prometheus and /var/lib/prometheus first if you need to keep configuration, rules, or time series data.
Remove the APT Package
sudo systemctl disable --now prometheus
sudo apt remove prometheus
If you want to remove package configuration as well, purge the package:
sudo apt purge prometheusReview any auto-removal plan before deleting dependencies, because APT may list packages that were already unused before this Prometheus install:
apt-get -s autoremoveWhen the simulated output only lists packages you are comfortable removing, run:
sudo apt autoremoveRemove the Upstream Installation
sudo systemctl disable --now prometheus
sudo rm -f /etc/systemd/system/prometheus.service
sudo systemctl daemon-reload
sudo rm -f /usr/local/bin/prometheus /usr/local/bin/promtool /usr/local/bin/prometheus-upstream-install
Check the size of the configuration and data directories before deleting them:
sudo du -sh /etc/prometheus /var/lib/prometheus 2>/dev/nullAfter confirming you no longer need those files, remove the directories and dedicated service account:
sudo rm -rf /etc/prometheus /var/lib/prometheus
sudo userdel prometheus
sudo groupdel prometheus
Troubleshoot Prometheus on Ubuntu
If Prometheus does not start, inspect the unit and recent logs first:
systemctl status prometheus --no-pager
journalctl -u prometheus -n 80 --no-pager
If the logs point to a configuration problem, run promtool directly:
sudo promtool check config /etc/prometheus/prometheus.ymlIf the web interface is unreachable, verify where Prometheus is listening and whether the firewall allows the expected source:
sudo ss -ltnp | grep ':9090'
sudo ufw status verbose
If the upstream helper refuses to run because the Ubuntu package is installed, choose one method and remove the other. Use dpkg-query to confirm whether the APT package is present:
dpkg-query -W -f='${db:Status-Abbrev} ${Package} ${Version}\n' prometheus 2>/dev/nullConclusion
For most Ubuntu servers, install Prometheus with APT, keep the service bound to localhost, and add scrape targets only after validating them with promtool. Use the upstream helper when you need the current stable Prometheus release from the project, and rerun it as part of your update routine. After installation, verify the service, readiness endpoint, listener address, and firewall scope before relying on the server for monitoring.

Formatting tips for your comment
You can use basic HTML to format your comment. Useful tags currently allowed in published comments:
<code>command</code>command<strong>bold</strong><em>italic</em><a href="https://example.com">link</a><blockquote>quote</blockquote>