Process problems are easier to handle when you can freeze the current state before restarting a service or killing a PID. The ps command in Linux reports a snapshot of running processes, so you can inspect ownership, parent-child relationships, CPU and memory fields, process states, command lines, and thread counts without opening an interactive monitor.
Most full Linux systems provide ps through the procps or procps-ng package family. Common distributions such as Ubuntu and Fedora use the procps-ng implementation, where ps accepts Unix-style options with a dash, BSD-style options without a dash, and GNU long options with two dashes.
Use ps when you need a point-in-time process report. For changing output that stays attached to a live process or log, combine the PID information from ps with tail command examples for live log watching.
Understand the ps Command
ps reads process information from the kernel’s process table and prints the selected rows. Unlike top or htop, it does not refresh the screen continuously. That makes it better for scripts, one-off diagnostics, support tickets, and command output you want to paste into notes.
ps Command Syntax
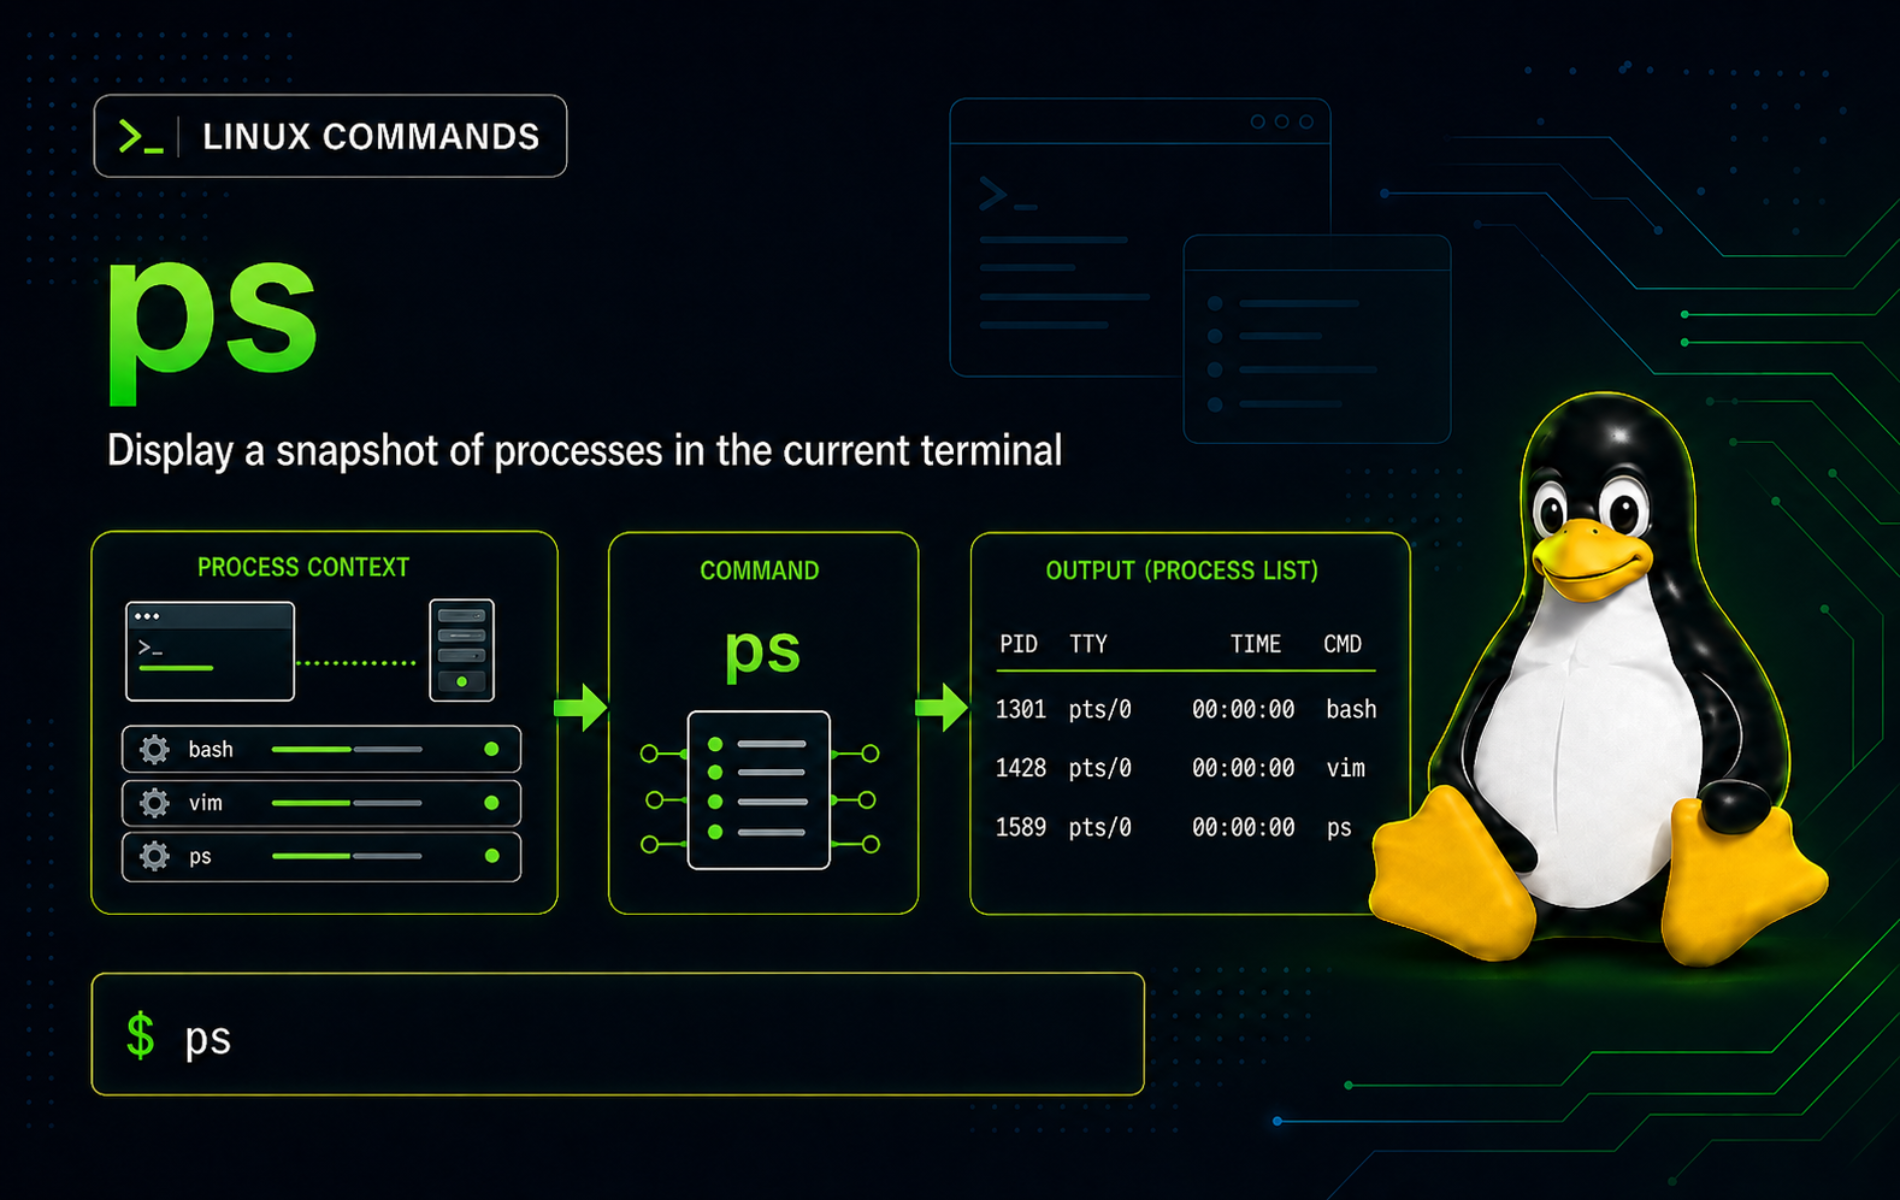
ps [OPTIONS]The default command shows processes owned by your effective user that are attached to the same terminal session:
psExample output:
    PID TTY          TIME CMD
   2797 ?        00:00:02 systemd
   2809 ?        00:00:00 (sd-pam)
   2829 ?        00:00:00 dbus-daemon
The default columns are intentionally small. PID identifies the process, TTY shows the controlling terminal or ? for no terminal, TIME shows accumulated CPU time, and CMD shows the command name.
ps Option Families
Linux ps keeps compatibility with several historical option styles. The style matters because BSD options can change the default selected processes and columns.
| Option Style | Example | How to Read It |
|---|---|---|
| Unix style | ps -ef | Options use a leading dash and can be combined, such as -e for all processes and -f for full format. |
| BSD style | ps aux | Options normally have no dash. The common aux form lists processes for all users with user-oriented columns. |
| GNU long style | ps --sort=-pcpu | Long options use two dashes and are useful for readable scripts or less familiar options. |
Keep
ps auxandps -efas separate habits. Adding a dash to BSD-styleauxcan change how some implementations parse the command, whileps auxandps -efare the familiar forms on procps-ng systems.
ps Command Quick Reference
| Task | Command Pattern | What It Shows |
|---|---|---|
| Show your current terminal’s processes | ps | Small default report for the current user and terminal context. |
| List every process with full columns | ps -ef | All processes with UID, PID, PPID, start time, terminal, CPU time, and command. |
| Use the common BSD process view | ps aux | All users with CPU, memory, VSZ, RSS, TTY, STAT, START, TIME, and COMMAND columns. |
| Inspect one PID | ps -p 1 -o pid,ppid,stat,comm,args | Selected columns for a specific process ID. |
| Show processes for one user | ps -u "$USER" -o pid,tty,stat,time,cmd | Processes owned by the current effective user. |
| Sort by CPU use | ps -eo pid,ppid,user,stat,pcpu,pmem,etime,cmd --sort=-pcpu | Custom process table ordered by highest lifetime CPU percentage first. |
| Print a process tree | ps -ejH | Hierarchy view using standard columns. |
| Show threads | ps -eLf | Process and thread rows, including LWP and NLWP fields. |
Verify the ps Command on Linux
Confirm the executable and implementation before relying on procps-ng fields such as pcpu, pmem, etime, or --sort:
command -v ps
ps --version | head -n 1
Example output from a procps-ng system:
/usr/bin/ps
ps from procps-ng 4.0.6
Ubuntu and Debian-family systems normally provide /usr/bin/ps from the procps package. Fedora provides it from procps-ng. Minimal containers, recovery shells, and embedded systems may expose a smaller BusyBox implementation, so use local help or the packaged manual before copying procps-ng-specific options into scripts.
The online ps(1) manual page is useful when you need the complete option list, output format specifiers, process state codes, and compatibility notes for the procps-ng implementation.
List Processes with ps
Start with the view that matches the question. A small current-session report is useful for terminal jobs, while all-process views are better for services, desktop sessions, and system-wide triage.
Show Every Process with Standard Syntax
The -e option selects every process, and -f adds a full-format column set with parent PID and command-line details:
ps -efExample output starts with a header and one row per process:
UID          PID    PPID  C STIME TTY          TIME CMD
root           1       0  2 18:45 ?        00:01:07 /usr/lib/systemd/systemd --switched-root --system --deserialize=55 rhgb
root           2       0  0 18:45 ?        00:00:00 [kthreadd]
Use this form when the parent-child relationship matters. PPID is often the next field to inspect when a child process keeps respawning or a zombie process needs its parent identified.
Use the ps aux View
The BSD-style aux view is common because it includes CPU, memory, process state, and command-line columns in one report:
ps auxExample output:
USER         PID %CPU %MEM    VSZ   RSS TTY      STAT START   TIME COMMAND
root           1  2.3  0.5  41076 22672 ?        Ss   18:45   1:07 /usr/lib/systemd/systemd --switched-root --system --deserialize=55 rhgb
root           2  0.0  0.0      0     0 ?        S    18:45   0:00 [kthreadd]
Use ps aux for a fast overview when you need resource columns. The values are a snapshot, and short-lived commands can briefly report surprising CPU percentages because the calculation depends on process lifetime.
Show Processes for the Current User
Limit output to your current effective user when system-wide rows make the report noisy:
ps -u "$USER" -o pid,tty,stat,time,cmdThe -u option selects by effective user. Use -U when you specifically need real user ID selection instead.
Inspect a Specific Process with ps
PID-specific checks keep troubleshooting precise. Create a disposable process named lc-ps-demo through its argument list, then inspect that process by PID.
bash -c 'exec -a lc-ps-demo sleep 300' &
demo_pid=$!
Inspect the PID with selected columns:
ps -p "$demo_pid" -o pid,ppid,stat,etime,comm=NAME,args=COMMANDExample output:
    PID    PPID STAT     ELAPSED NAME            COMMAND
  17864   17863 S          00:00 sleep           lc-ps-demo 300
The comm field reports the executable name, while args reports the command line. That distinction matters when a script changes its argument name or when several processes use the same binary.
Print PID Output Without Headers
Scripts often need values without a header row. Empty headers after the equals signs suppress the column names:
ps -p "$demo_pid" -o pid= -o comm=Example output:
17864 sleep
Use multiple -o options when in doubt. It avoids ambiguity in some personality modes and keeps each header override attached to one field.
Check Whether a PID Still Exists
ps -p exits successfully when the PID is still listed. That makes it useful for simple shell checks:
if ps -p "$demo_pid" >/dev/null; then
    printf 'Process is running\n'
else
    printf 'Process is not running\n'
fi
Customize ps Output Columns
Custom output formats make ps more useful than memorizing many preset views. Choose fields that answer the current question, then sort or filter the resulting table.
Build a Process Triage View
Use -e for all processes and -o for a comma-separated field list:
ps -eo pid,ppid,user,stat,pcpu,pmem,etime,cmdThis view includes parent PID, owner, process state, lifetime CPU percentage, memory percentage, elapsed time, and command line. It is a good default when a system feels busy and you need enough context to decide the next check.
Rename Column Headers
Add a custom header after the equals sign when a report needs clearer names:
ps -p 1 -o pid=PID -o ppid=PARENT -o stat=STATE -o comm=NAMEHeader renaming is especially useful in scripts that write small reports for humans. For machine-readable output, consider suppressing headers and using a delimiter-aware tool around the fields you actually need.
Show Full Command Lines
Use args or cmd when command-line arguments matter:
ps -eo pid,user,stat,argsUse comm when you only need the executable name. This avoids long argument strings, but it can hide the configuration file, worker role, port, or subcommand that explains why the process exists.
Sort and Filter ps Output
Sorting turns a large process table into a triage report. Use process fields for sorting, then keep the displayed columns focused on the decision you need to make.
Sort by CPU Usage
Sort by descending pcpu when CPU pressure is the first symptom:
ps -eo pid,ppid,user,stat,pcpu,pmem,etime,cmd --sort=-pcpu | head -n 10The - before pcpu sorts from highest to lowest. Short-lived commands can appear near the top briefly, so recheck suspicious rows or switch to an interactive monitor when the load changes quickly.
Sort by Memory Usage
Sort by descending resident memory percentage when memory pressure is the problem:
ps -eo pid,ppid,user,stat,pcpu,pmem,rss,cmd --sort=-pmem | head -n 10pmem is the process’s resident memory share as a percentage. rss prints resident set size in KiB, which is often easier to compare when deciding whether one process is materially larger than the rest.
Filter by Command Name Carefully
The -C selector matches the executable command name, not the full argument string. That means a process launched as lc-ps-demo through its arguments still has the executable name sleep:
ps -C sleep -o pid,stat,comm,argsFor command-line text filters, use a bracketed pattern to avoid matching the filter process itself:
ps -eo pid,ppid,stat,args | grep '[l]c-ps-demo'The bracketed pattern still matches lc-ps-demo in process output, but it does not match the literal grep '[l]c-ps-demo' command line. Treat this as text filtering around ps, not as a full process selector.
Show Process Trees and Threads
Parent-child and thread views help when one service starts workers, shells launch child commands, or an application creates many threads under one PID.
Print a Process Tree
Use -H with a standard all-process selection to indent child processes under their parents:
ps -ejHExample output starts with kernel and system processes, then indents children beneath their parent rows:
    PID    PGID     SID TTY          TIME CMD
      2       0       0 ?        00:00:00 kthreadd
      3       0       0 ?        00:00:00   pool_workqueue_release
      4       0       0 ?        00:00:00   kworker/R-rcu_gp
Use a tree view when you need to know whether a process is standalone or part of a larger service, login session, build, or script.
Show Threads with ps
The -L option displays threads. Combined with -e and -f, it adds LWP and NLWP fields:
ps -eLfExample output:
UID          PID    PPID     LWP  C NLWP STIME TTY          TIME CMD
root           1       0       1  2    1 18:45 ?        00:01:07 /usr/lib/systemd/systemd --switched-root --system --deserialize=55 rhgb
root           2       0       2  0    1 18:45 ?        00:00:00 [kthreadd]
LWP identifies the thread row, while NLWP reports how many lightweight processes or threads belong to the process. This view is useful when one PID appears idle or busy but the thread count tells a different story.
Interpret Common ps Columns and STAT Codes
ps output is compact, so a few columns and state codes do most of the diagnostic work.
Common ps Columns
| Column | Meaning | Useful Check |
|---|---|---|
PID | Process ID. | Use it for targeted inspection, signals, and parent-child checks. |
PPID | Parent process ID. | Find what launched or owns a child process. |
TTY | Controlling terminal. | ? usually means the process is not attached to a terminal. |
STAT | Process state plus modifiers. | Check whether the process is sleeping, running, stopped, zombie, multithreaded, or foreground. |
TIME | Accumulated CPU time. | Distinguish long-running CPU consumers from briefly active commands. |
RSS | Resident memory in KiB. | Compare real memory pressure more directly than virtual size. |
VSZ | Virtual memory size in KiB. | Useful context, but not the same as resident memory currently held in RAM. |
CMD or COMMAND | Command name or full command line, depending on the format. | Use args when arguments decide what the process is doing. |
Common STAT Values
| Code | Meaning | How to Use It |
|---|---|---|
R | Running or runnable. | The process is on CPU or ready to run. |
S | Interruptible sleep. | Normal wait state for many services and idle processes. |
D | Uninterruptible sleep. | Often points to I/O waits, storage issues, or kernel-level waits. |
T | Stopped or traced. | Common after job control stops or debugging. |
Z | Zombie. | The process has exited, but its parent has not collected the exit status. |
s | Session leader modifier. | Often appears on login shells, services, or session roots. |
l | Multithreaded modifier. | Use thread views when thread count matters. |
+ | Foreground process group modifier. | Usually marks the process group attached to the terminal foreground. |
State codes describe the process at the instant ps reads it. Recheck a suspicious row before acting, especially for short-lived commands or processes switching quickly between running and sleeping.
Use ps Safely in Scripts
ps is scriptable, but stable scripts should avoid depending on the visual spacing of ps aux. Select exact columns, suppress headers when needed, and treat missing processes as a normal branch rather than an unexpected failure.
Prefer Explicit Columns
Use exact output fields when another command will consume the result:
ps -p "$demo_pid" -o pid= -o stat= -o comm=The empty headers make the result easier to parse, while separate -o arguments keep each requested field unambiguous.
Use command -v for Availability Checks
Use the shell’s command lookup before a script depends on ps:
if ! command -v ps >/dev/null; then
    printf 'ps is not available in PATH\n' >&2
fi
If the problem is broader command discovery rather than process inspection, inspect binary, source, and manual paths with whereis before changing packages or shell paths.
Troubleshoot Common ps Output Problems
Most ps confusion comes from selection scope, option style, process names versus command lines, and interpreting state codes too aggressively from a single snapshot.
Only a Few Processes Appear
The plain ps command selects processes for the current user and terminal context. If services, desktop processes, or other users are missing, widen the selection first:
ps -ef
ps aux
Use ps -ef when parent PID and standard Unix-style columns matter. Use ps aux when CPU, memory, and state columns are the priority.
A Command Name Filter Misses the Process
ps -C matches the executable name, not arbitrary text in the full command line. Prove the two fields before assuming the process is absent:
ps -p "$demo_pid" -o comm=NAME -o args=COMMANDIf NAME is sleep but COMMAND contains lc-ps-demo 300, select by PID or filter the args field instead of relying on -C lc-ps-demo.
CPU or Memory Output Looks Too High
%CPU is not a fresh sampling window like an interactive monitor. It is based on CPU time over process lifetime, so very new commands can look inflated for a moment.
ps -p "$demo_pid" -o pid,pcpu,pmem,etime,cmdCheck ETIME beside pcpu before acting on a high value. If the row is only a few seconds old, take another snapshot or switch to a live monitor before blaming that process for sustained load.
A Zombie Process Shows STAT Z
A Z state means the child process has exited, but the parent has not collected its status. Sending a signal to the zombie itself usually does not solve the problem because the process is already gone.
ps -eo pid,ppid,stat,cmd | awk '$3 ~ /^Z/ { print }'Use the PPID value to identify the parent process, then investigate or restart the parent service if zombies keep accumulating. A single short-lived zombie can disappear on its own when the parent reaps the exit status.
Clean Up the Demo Process
If you created the disposable lc-ps-demo process, stop it after the PID, sorting, filtering, and troubleshooting checks are complete:
if [ -n "${demo_pid:-}" ]; then
    kill "$demo_pid" 2>/dev/null || true
    wait "$demo_pid" 2>/dev/null || true
fi
Conclusion
ps gives you a reliable process snapshot with PID, parent, owner, state, resource, tree, thread, and command-line views. Use targeted columns before taking action, then move to logs, a live monitor, or service-specific tooling when a single snapshot does not explain the process behavior.

Formatting tips for your comment
You can use basic HTML to format your comment. Useful tags currently allowed in published comments:
<code>command</code>command<strong>bold</strong><em>italic</em><a href="https://example.com">link</a><blockquote>quote</blockquote>